Zynga 2014 Annual Report Download - page 97
Download and view the complete annual report
Please find page 97 of the 2014 Zynga annual report below. You can navigate through the pages in the report by either clicking on the pages listed below, or by using the keyword search tool below to find specific information within the annual report.-
 1
1 -
2
-
3
-
4
-
5
-
6
-
7
-
8
-
9
-
10
-
11
-
12
-
13
-
14
-
15
-
16
-
17
-
18
-
19
-
20
-
21
-
22
-
23
-
24
-
25
-
26
-
27
-
28
-
29
-
30
-
31
-
32
-
33
-
34
-
35
-
36
-
37
-
38
-
39
-
40
-
41
-
42
-
43
-
44
-
45
-
46
-
47
-
48
-
49
-
50
-
51
-
52
-
53
-
54
-
55
-
56
-
57
-
58
-
59
-
60
-
61
-
62
-
63
-
64
-
65
-
66
-
67
-
68
-
69
-
70
-
71
-
72
-
73
-
74
-
75
-
76
-
77
-
78
-
79
-
80
-
81
-
82
-
83
-
84
-
85
-
86
-
 87
87 -
 88
88 -
 89
89 -
 90
90 -
 91
91 -
 92
92 -
 93
93 -
 94
94 -
 95
95 -
 96
96 -
 97
97 -
 98
98 -
 99
99 -
 100
100 -
 101
101 -
 102
102 -
 103
103 -
 104
104 -
 105
105 -
 106
106 -
 107
107 -
108
-
109
-
110
-
111
-
112
-
113
-
114
-
115
-
116
-
117
-
118
-
119
-
120
-
121
-
122
-
123
-
124
-
125
 |
 |
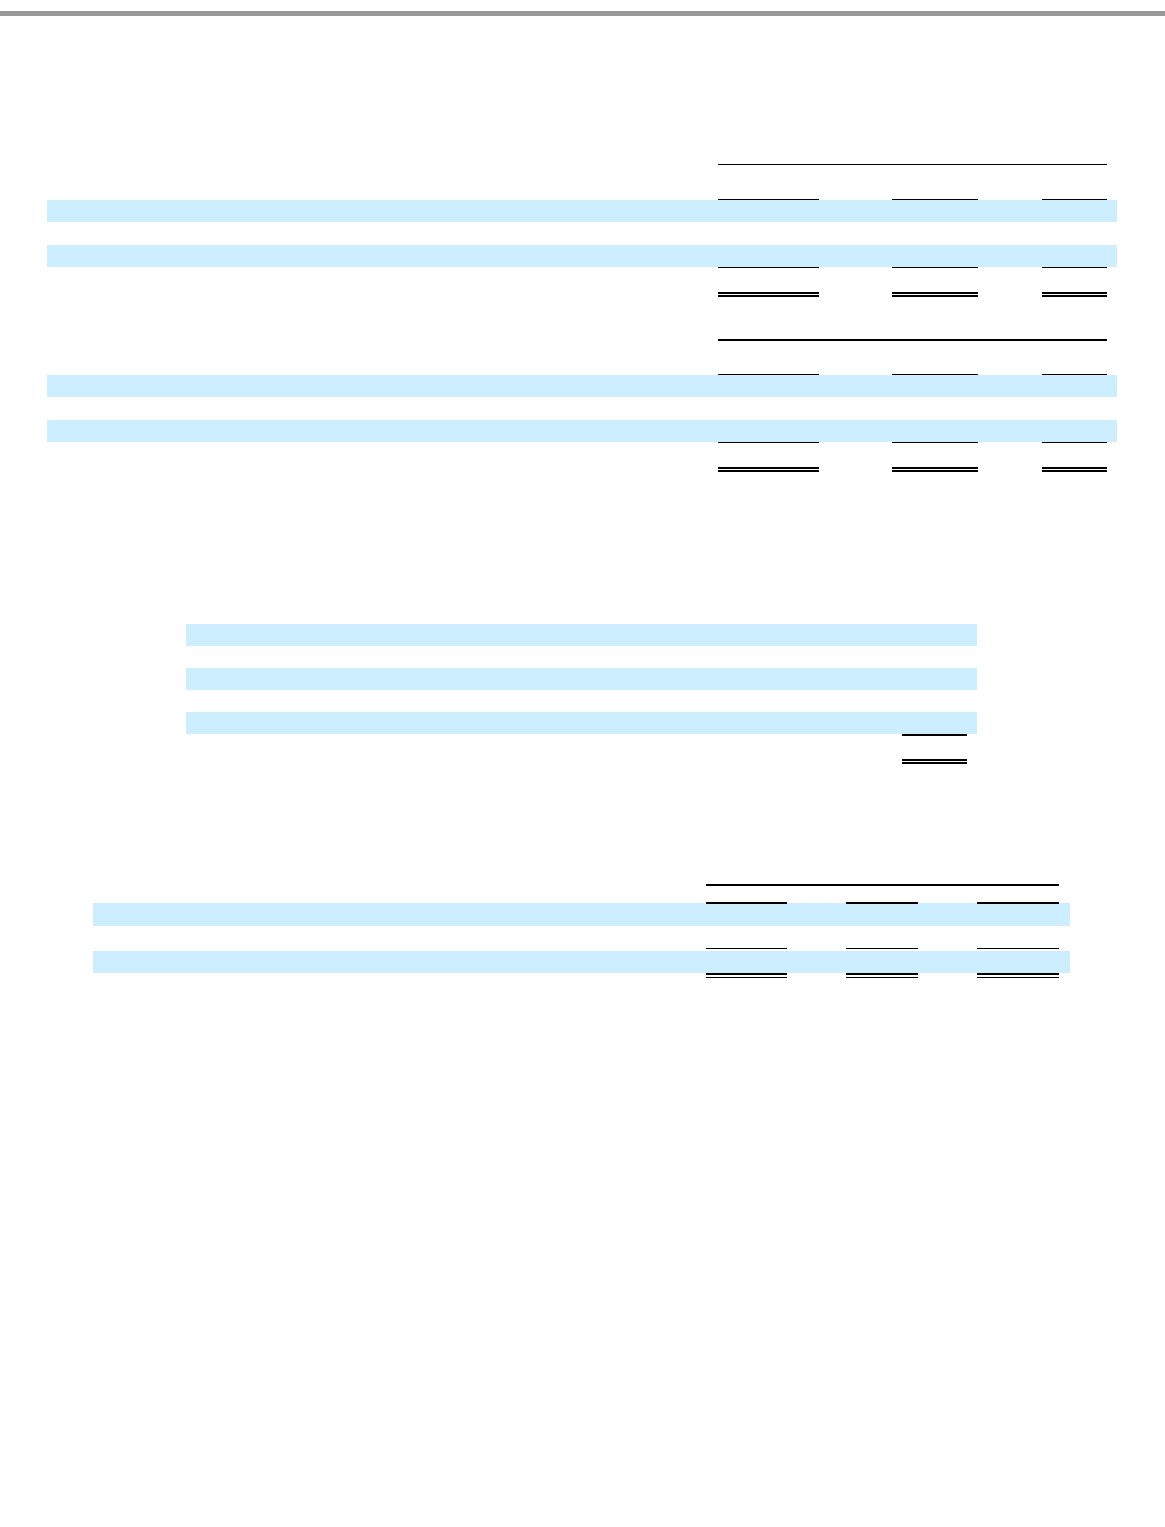
Table of Contents
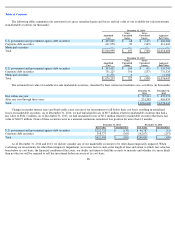
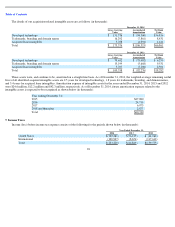
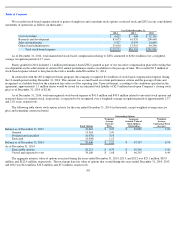
The details of our acquisition-related intangible assets are as follows (in thousands):
These assets were, and continue to be, amortized on a straight-line basis. As of December 31, 2014, the weighted-
average remaining useful
lives of all identified acquired intangible assets are 2.5 years for developed technology, 1.8 years for trademarks, branding, and domain names,
and 3.4 years for acquired lease intangibles. Amortization expense of intangible assets for the years ended December 31, 2014, 2013 and 2012
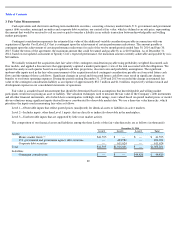
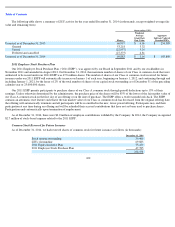
were $24.6 million, $12.2 million and $42.3 million, respectively. As of December 31, 2014, future amortization expense related to the
intangible assets is expected to be recognized as shown below (in thousands):
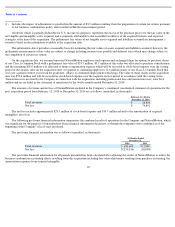
7. Income Taxes
Income (loss) before income tax expense consists of the following for the periods shown below (in thousands):
94
December 31, 2014
Gross Carrying
Value
Accumulated
Amortization
Net Book
Value
Developed technology
$
151,376
$
(94,560
)
$
56,816
Trademarks, branding and domain names
16,292
(7,861
)
8,431
Acquired lease intangibles
5,708
(4,094
)
1,614
Total
$
173,376
$
(106,515
)
$
66,861
December 31, 2013
Gross Carrying
Value
Accumulated
Amortization
Net Book
Value
Developed technology
$
79,652
$
(73,402
)
$
6,250
Trademarks, branding and domain names
15,199
(5,668
)
9,531
Acquired lease intangibles
5,707
(3,206
)
2,501
Total
$
100,558
$
(82,276
)
$
18,282
Year ending December 31:
2015
$
27,080
2016
24,710
2017
6,073
2018 and thereafter
2,877
Total
$
60,740
Year Ended December 31,
2014
2013
2012
United States
$
(132,281
)
$
(56,215
)
$
(41,963
)
International
(100,947
)
(8,654
)
(117,612
)
Total
$
(233,228
)
$
(64,869
)
$
(159,575
)