Zynga 2014 Annual Report Download - page 104
Download and view the complete annual report
Please find page 104 of the 2014 Zynga annual report below. You can navigate through the pages in the report by either clicking on the pages listed below, or by using the keyword search tool below to find specific information within the annual report.-
 1
1 -
2
-
3
-
4
-
5
-
6
-
7
-
8
-
9
-
10
-
11
-
12
-
13
-
14
-
15
-
16
-
17
-
18
-
19
-
20
-
21
-
22
-
23
-
24
-
25
-
26
-
27
-
28
-
29
-
30
-
31
-
32
-
33
-
34
-
35
-
36
-
37
-
38
-
39
-
40
-
41
-
42
-
43
-
44
-
45
-
46
-
47
-
48
-
49
-
50
-
51
-
52
-
53
-
54
-
55
-
56
-
57
-
58
-
59
-
60
-
61
-
62
-
63
-
64
-
65
-
66
-
67
-
68
-
69
-
70
-
71
-
72
-
73
-
74
-
75
-
76
-
77
-
78
-
79
-
80
-
81
-
82
-
83
-
84
-
85
-
86
-
87
-
88
-
89
-
90
-
91
-
92
-
93
-
 94
94 -
 95
95 -
 96
96 -
 97
97 -
 98
98 -
 99
99 -
 100
100 -
 101
101 -
 102
102 -
 103
103 -
 104
104 -
 105
105 -
 106
106 -
 107
107 -
 108
108 -
 109
109 -
 110
110 -
 111
111 -
 112
112 -
 113
113 -
 114
114 -
115
-
116
-
117
-
118
-
119
-
120
-
121
-
122
-
123
-
124
-
125
 |
 |

Table of Contents
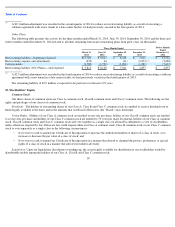
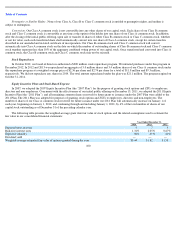
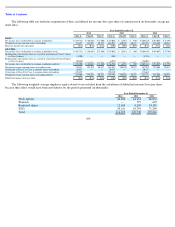
We recorded stock-
based expense related to grants of employee and consultant stock options, restricted stock and ZSUs in our consolidated
statements of operations as follows (in thousands):
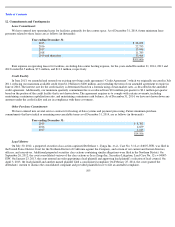
As of December 31, 2014, total unamortized stock-based compensation relating to ZSUs amounted to $202.4 million over a weighted-
average recognition period of 2.7 years.
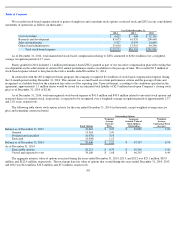
Shares granted in 2014 included 1.1 million performance-based ZSUs granted as part of our executive compensation plan with vesting that
was dependent on the achievement of certain 2014 annual performance metrics in addition to the passage of time. We recorded $2.2 million of
stock-based expense related to this plan in the twelve months ended December 31, 2014.
In connection with the 2014 employee bonus program, the company recognized $2.4 million of stock based compensation expense during
the 12-month period ending December 31, 2014. This amount was accrued based on certain performance criteria and the passage of time and
recognized as a liability based on the estimated fair value as of the reporting date. Upon settlement, according to the conditions specified in the
agreement, approximately 1.1 million shares would be issued for an estimated total liability of $2.9 million based upon Company’
s closing stock
price as of December 31, 2014 of $2.66.
As of December 31, 2014, total unrecognized stock-
based expense of $41.0 million and $45.0 million related to unvested stock options and
restricted shares of common stock, respectively, is expected to be recognized over a weighted-average recognition period of approximately 2.37
and 2.01 years, respectively.
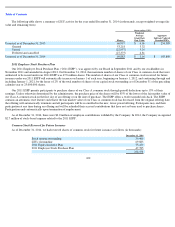
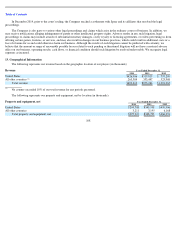
The following table shows stock option activity for the year ended December 31, 2014 (in thousands, except weighted-average exercise
price and remaining contractual term):
The aggregate intrinsic value of options exercised during the years ended December 31, 2014, 2013, and 2012 was $25.1 million, $85.9
million, and $222.4 million, respectively. The total grant date fair value of options that vested during the years ended December 31, 2014, 2013,
and 2012 was $6.6 million, $12.8 million, and $7.6 million, respectively.
101
Year Ended December 31,
2014
2013
2012
Cost of revenue
$
4,623
$
468
$
12,116
Research and development
83,673
61,931
200,640
Sales and marketing
5,927
8,079
24,684
General and administrative
35,010
13,915
44,546
Total stock
-
based expense
$
129,233
$
84,393
$
281,986
Outstanding Options
Stock Options
Weighted
-
Average
Exercise
Price
Aggregate
Intrinsic Value of
Stock Options
Outstanding
Weighted
-
Average
Contractual Term
(in years)
Balance as of December 31, 2013
41,081
$
2.07
$
83,089
7.02
Granted
13,363
2.41
Forfeited and cancelled
(6,076
)
3.19
Exercised
(8,908
)
1.13
Balance as of December 31, 2014
39,460
$
2.22
$
47,347
6.74
As of December 31, 2014
Exercisable options
20,213
$
0.79
$
39,349
5.10
Vested and expected to vest
34,160
$
1.68
$
46,367
6.44