Zynga 2014 Annual Report Download - page 82
Download and view the complete annual report
Please find page 82 of the 2014 Zynga annual report below. You can navigate through the pages in the report by either clicking on the pages listed below, or by using the keyword search tool below to find specific information within the annual report.-
 1
1 -
2
-
3
-
4
-
5
-
6
-
7
-
8
-
9
-
10
-
11
-
12
-
13
-
14
-
15
-
16
-
17
-
18
-
19
-
20
-
21
-
22
-
23
-
24
-
25
-
26
-
27
-
28
-
29
-
30
-
31
-
32
-
33
-
34
-
35
-
36
-
37
-
38
-
39
-
40
-
41
-
42
-
43
-
44
-
45
-
46
-
47
-
48
-
49
-
50
-
51
-
52
-
53
-
54
-
55
-
56
-
57
-
58
-
59
-
60
-
61
-
62
-
63
-
64
-
65
-
66
-
67
-
68
-
69
-
70
-
71
-
 72
72 -
 73
73 -
 74
74 -
 75
75 -
 76
76 -
 77
77 -
 78
78 -
 79
79 -
 80
80 -
 81
81 -
 82
82 -
 83
83 -
 84
84 -
 85
85 -
 86
86 -
 87
87 -
 88
88 -
 89
89 -
 90
90 -
 91
91 -
 92
92 -
93
-
94
-
95
-
96
-
97
-
98
-
99
-
100
-
101
-
102
-
103
-
104
-
105
-
106
-
107
-
108
-
109
-
110
-
111
-
112
-
113
-
114
-
115
-
116
-
117
-
118
-
119
-
120
-
121
-
122
-
123
-
124
-
125
 |
 |

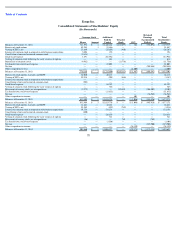
Table of Contents
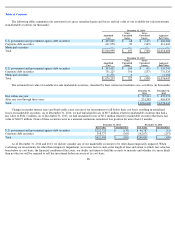
Zynga Inc.
Consolidated Statements of Cash Flows
(In thousands)
See accompanying notes.
79
Year Ended December 31,
2014
2013
2012
Operating activities:
Net income (loss)
$
(225,900
)
$
(36,982
)
$
(209,448
)
Adjustments to reconcile net income (loss) to net cash provided by operating activities:
Depreciation and amortization
82,894
129,047
141,479
Stock
-
based expense
129,233
84,393
281,986
(Gain) loss from sales of investments, assets and other, net
(1,610
)
8,147
563
Net gain on termination of lease and purchase of building
—
—
(
19,886
)
Tax benefits (costs) from stock
-
based awards
(86
)
(11,244
)
21,652
Excess tax benefits (costs) from stock
-
based awards
86
11,244
(21,652
)
Accretion and amortization on marketable securities
10,061
17,575
17,223
Deferred income taxes
(10,982
)
(18,766
)
(43,841
)
Impairment of intangible assets
—
10,217
95,493
Changes in operating assets and liabilities:
Accounts receivable, net
(16,489
)
40,806
34,338
Income tax receivable
5,433
(1,336
)
12,976
Other assets
971
3,932
19,908
Accounts payable
(6,393
)
(2,325
)
(21,312
)
Deferred revenue
3,643
(157,090
)
(133,640
)
Other liabilities
24,628
(48,944
)
19,928
Net cash provided by (used in) operating activities
(4,511
)
28,674
195,767
Investing activities:
Purchases of marketable securities
(758,509
)
(1,074,919
)
(1,826,137
)
Sales and maturities of marketable securities
806,232
1,244,841
871,744
Purchase of corporate headquarters building
—
—
(
233,700
)
Acquisition of property and equipment
(9,201
)
(7,813
)
(98,054
)
Business acquisition, net of cash acquired
(392,411
)
(18,054
)
(205,510
)
Proceeds from sale of property and equipment
5,059
3,057
—
Equity method investment
—
—
(
10,000
)
Restricted cash
—
227
6,979
Other investing activities, net
4,671
137
(2,256
)
Net cash provided by (used in) investing activities
(344,159
)
147,476
(1,496,934
)
Financing activities:
Proceeds from debt, net of issuance costs
—
—
99,780
Taxes paid related to net share settlement of equity awards
(1,216
)
(1,387
)
(26,307
)
Repurchases of common stock
—
(
9,302
)
(11,756
)
Proceeds from employee stock purchase plan and exercise of stock options
16,421
26,115
21,449
Excess tax benefits from stock
-
based awards
(86
)
(11,244
)
21,652
Repayment of debt
—
(
100,000
)
—
Net cash provided by (used in) financing activities
15,119
(95,818
)
104,818
Effect of exchange rate changes on cash and cash equivalents
(669
)
(758
)
(45
)
Net increase (decrease) in cash and cash equivalents
(334,220
)
79,574
(1,196,394
)
Cash and cash equivalents, beginning of period
465,523
385,949
1,582,343
Cash and cash equivalents, end of period
$
131,303
$
465,523
$
385,949