Zynga 2014 Annual Report Download - page 90
Download and view the complete annual report
Please find page 90 of the 2014 Zynga annual report below. You can navigate through the pages in the report by either clicking on the pages listed below, or by using the keyword search tool below to find specific information within the annual report.-
 1
1 -
2
-
3
-
4
-
5
-
6
-
7
-
8
-
9
-
10
-
11
-
12
-
13
-
14
-
15
-
16
-
17
-
18
-
19
-
20
-
21
-
22
-
23
-
24
-
25
-
26
-
27
-
28
-
29
-
30
-
31
-
32
-
33
-
34
-
35
-
36
-
37
-
38
-
39
-
40
-
41
-
42
-
43
-
44
-
45
-
46
-
47
-
48
-
49
-
50
-
51
-
52
-
53
-
54
-
55
-
56
-
57
-
58
-
59
-
60
-
61
-
62
-
63
-
64
-
65
-
66
-
67
-
68
-
69
-
70
-
71
-
72
-
73
-
74
-
75
-
76
-
77
-
78
-
79
-
 80
80 -
 81
81 -
 82
82 -
 83
83 -
 84
84 -
 85
85 -
 86
86 -
 87
87 -
 88
88 -
 89
89 -
 90
90 -
 91
91 -
 92
92 -
 93
93 -
 94
94 -
 95
95 -
 96
96 -
 97
97 -
 98
98 -
 99
99 -
 100
100 -
101
-
102
-
103
-
104
-
105
-
106
-
107
-
108
-
109
-
110
-
111
-
112
-
113
-
114
-
115
-
116
-
117
-
118
-
119
-
120
-
121
-
122
-
123
-
124
-
125
 |
 |

Table of Contents
that may impair a specific customer’s ability to meet its financial obligations, we record a specific allowance as a reduction to the accounts
receivable balance to reduce it to its net realizable value.
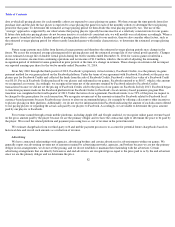
Facebook is a significant distribution, marketing, promotion and payment platform for our social games. A significant portion of our 2014,
2013 and 2012 revenue was generated from players who accessed our games through Facebook. As of December 31, 2014 and December 31,
2013, 22% and 41% of our accounts receivable, respectively, were amounts owed to us by Facebook. Additionally, as of December 31, 2014 and
December 31, 2013, 23% and 15% of our accounts receivable, respectively, were amounts owed to us by Apple.
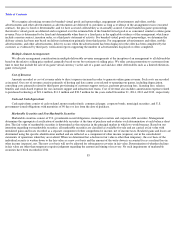
Advertising Expense
Costs for advertising are expensed as incurred. Advertising costs, which are included in sales and marketing expense, primarily consisting
of player acquisition costs, totaled $101.7 million, $60.6 million and $102.2 million for the years ended December 31, 2014, 2013 and 2012,
respectively.
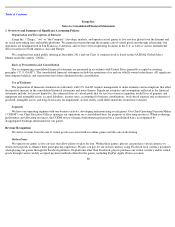
Recent Accounting Pronouncements
In June 2013, the Financial Accounting Standards Board ratified Accounting Standards Update 2013-11, “ Presentation of an
Unrecognized Tax Benefit When a Net Operating Loss Carryforward, a Similar Tax Loss, or a Tax Credit Carryforward Exists ” which
concludes an unrecognized tax benefit should be presented as a reduction of a deferred tax asset when settlement in this manner is available
under the tax law. We adopted this amendment in the first quarter of 2014, which resulted in a reduction of non-current liabilities of $33.3
million.
In May 2014, the Financial Accounting Standards Board issued Accounting Standards Update (“ASU”) 2014-09, “ Revenue from
Contracts with Customers ,” which requires revenue to be recognized when promised goods or services are transferred to customers in an
amount that reflects the consideration that is expected to be received for those goods or services. ASU 2014-09 supersedes the existing revenue
recognition guidance in “ Revenue Recognition (Topic 605) ” and is effective in the first quarter of 2017. Early adoption is not permitted. We are
currently in the process of evaluating the impact of the adoption of ASU 2014-09 on our consolidated financial statements.
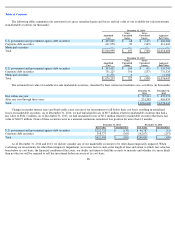
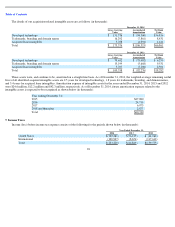
2. Cash and Investments
Cash and investments consist of the following (in thousands):
87
December 31,
2014
December 31,
2013
Cash and cash equivalents:
Cash
$
89,708
$
116,102
Money market funds
41,595
349,421
Total cash and cash equivalents
$
131,303
$
465,523
Marketable securities:
U.S. government and government agency debt securities
$
404,982
$
333,741
Corporate debt securities
611,624
731,324
Municipal securities
—
11,382
Total
$
1,016,606
$
1,076,447