Zynga 2014 Annual Report Download - page 51
Download and view the complete annual report
Please find page 51 of the 2014 Zynga annual report below. You can navigate through the pages in the report by either clicking on the pages listed below, or by using the keyword search tool below to find specific information within the annual report.-
 1
1 -
2
-
3
-
4
-
5
-
6
-
7
-
8
-
9
-
10
-
11
-
12
-
13
-
14
-
15
-
16
-
17
-
18
-
19
-
20
-
21
-
22
-
23
-
24
-
25
-
26
-
27
-
28
-
29
-
30
-
31
-
32
-
33
-
34
-
35
-
36
-
37
-
38
-
39
-
40
-
 41
41 -
 42
42 -
 43
43 -
 44
44 -
 45
45 -
 46
46 -
 47
47 -
 48
48 -
 49
49 -
 50
50 -
 51
51 -
 52
52 -
 53
53 -
 54
54 -
 55
55 -
 56
56 -
 57
57 -
 58
58 -
 59
59 -
 60
60 -
 61
61 -
62
-
63
-
64
-
65
-
66
-
67
-
68
-
69
-
70
-
71
-
72
-
73
-
74
-
75
-
76
-
77
-
78
-
79
-
80
-
81
-
82
-
83
-
84
-
85
-
86
-
87
-
88
-
89
-
90
-
91
-
92
-
93
-
94
-
95
-
96
-
97
-
98
-
99
-
100
-
101
-
102
-
103
-
104
-
105
-
106
-
107
-
108
-
109
-
110
-
111
-
112
-
113
-
114
-
115
-
116
-
117
-
118
-
119
-
120
-
121
-
122
-
123
-
124
-
125
 |
 |
Table of Contents
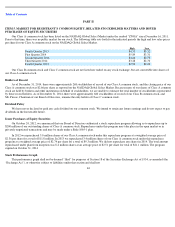
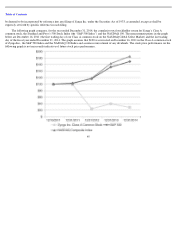
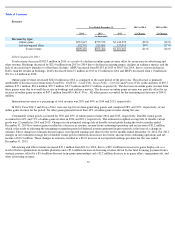
We use bookings to evaluate the results of our operations, generate future operating plans and assess the performance of our company.
While we believe that this non-GAAP financial measure is useful in evaluating our business, this information should be considered as
supplemental in nature and is not meant as a substitute for revenue recognized in accordance with GAAP. In addition, other companies,
including companies in our industry, may calculate bookings differently or not at all, which reduces its usefulness as a comparative measure.
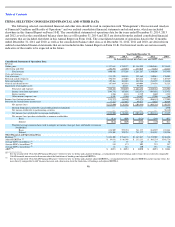
The following table is a reconciliation of revenue to bookings for each of the periods presented:
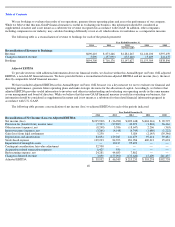
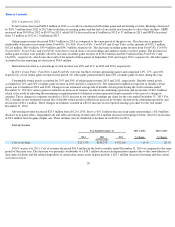
Adjusted EBITDA
To provide investors with additional information about our financial results, we disclose within this Annual Report on Form 10-K adjusted
EBITDA, a non-GAAP financial measure. We have provided below a reconciliation between adjusted EBITDA and net income (loss), the most
directly comparable GAAP financial measure.
We have included adjusted EBITDA in this Annual Report on Form 10-K because it is a key measure we use to evaluate our financial and
operating performance, generate future operating plans and make strategic decisions for the allocation of capital. Accordingly, we believe that
adjusted EBITDA provides useful information to investors and others in understanding and evaluating our operating results in the same manner
as our management and board of directors. While we believe that this non-GAAP financial measure is useful in evaluating our business, this
information should be considered as supplemental in nature and is not meant as a substitute for the related financial information prepared in
accordance with U.S. GAAP.
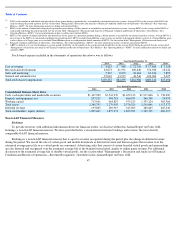
The following table presents a reconciliation of net income (loss) to adjusted EBITDA for each of the periods indicated:
48
Year Ended December 31,
2014
2013
2012
2011
2010
(in thousands)
Reconciliation of Revenue to Bookings:
Revenue
$
690,410
$
873,266
$
1,281,267
$
1,140,100
$
597,459
Change in deferred revenue
3,890
(157,090
)
(133,640
)
15,409
241,437
Bookings
$
694,300
$
716,176
$
1,147,627
$
1,155,509
$
838,896
Year Ended December 31,
2014
2013
2012
2011
2010
Reconciliation of Net Income (Loss) to Adjusted EBITDA:
Net income (loss)
$
(225,900
)
$
(36,982
)
$
(209,448
)
$
(404,316
)
$
90,595
Provision for (benefit from) income taxes
(7,327
)
(27,887
)
49,873
(1,826
)
36,464
Other income (expense), net
(8,248
)
3,386
(18,647
)
2,206
(365
)
Interest income (expense), net
(3,266
)
(4,148
)
(4,749
)
(1,680
)
(1,222
)
Gain (loss) from legal settlements
5,250
—
3,024
(2,145
)
(39,346
)
Depreciation and amortization
82,894
129,047
141,479
95,414
39,481
Stock
-
based expense
129,233
84,393
281,986
600,212
25,694
Impairment of intangible assets
—
10,217
95,493
—
—
Contingent consideration fair value adjustment
32,700
—
—
—
—
Acquisition
-
related transaction expenses
6,425
930
—
—
—
Restructuring expense, net
24,281
44,683
7,862
—
—
Change in deferred revenue
3,890
(157,090
)
(133,640
)
15,409
241,437
Adjusted EBITDA
$
39,932
$
46,549
$
213,233
$
303,274
$
392,738