Zynga 2014 Annual Report Download - page 61
Download and view the complete annual report
Please find page 61 of the 2014 Zynga annual report below. You can navigate through the pages in the report by either clicking on the pages listed below, or by using the keyword search tool below to find specific information within the annual report.-
 1
1 -
2
-
3
-
4
-
5
-
6
-
7
-
8
-
9
-
10
-
11
-
12
-
13
-
14
-
15
-
16
-
17
-
18
-
19
-
20
-
21
-
22
-
23
-
24
-
25
-
26
-
27
-
28
-
29
-
30
-
31
-
32
-
33
-
34
-
35
-
36
-
37
-
38
-
39
-
40
-
41
-
42
-
43
-
44
-
45
-
46
-
47
-
48
-
49
-
50
-
 51
51 -
 52
52 -
 53
53 -
 54
54 -
 55
55 -
 56
56 -
 57
57 -
 58
58 -
 59
59 -
 60
60 -
 61
61 -
 62
62 -
 63
63 -
 64
64 -
 65
65 -
 66
66 -
 67
67 -
 68
68 -
 69
69 -
 70
70 -
 71
71 -
72
-
73
-
74
-
75
-
76
-
77
-
78
-
79
-
80
-
81
-
82
-
83
-
84
-
85
-
86
-
87
-
88
-
89
-
90
-
91
-
92
-
93
-
94
-
95
-
96
-
97
-
98
-
99
-
100
-
101
-
102
-
103
-
104
-
105
-
106
-
107
-
108
-
109
-
110
-
111
-
112
-
113
-
114
-
115
-
116
-
117
-
118
-
119
-
120
-
121
-
122
-
123
-
124
-
125
 |
 |

Table of Contents
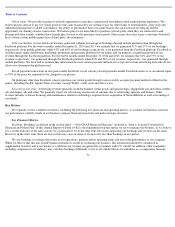
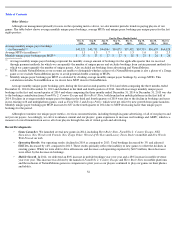
2013 Compared to 2012.
Total revenue decreased $408.0 million in 2013 as a result of a decline in both online game and advertising revenue. Bookings decreased
by $431.5 million from 2012 to 2013 due to declines in existing games and the lack of successful new launches to offset these declines. ABPU
increased from $0.050 in 2012 to $0.053 in 2013, while DAUs decreased from 63 million in 2012 to 37 million in 2013 and MUPs decreased
from 3.4 million in 2012 to 1.8 million in 2013.
Online game revenue decreased $384.7 million in 2013 as compared to the same period of the prior year. This decrease is primarily
attributable to decreases in revenue from FarmVille, CityVille, FrontierVille, CastleVille and Zynga Poker in the amounts of $152.1 million,
$112.6 million, $60.4 million, $59.4 million and $54.7 million, respectively. The decreases in online game revenue from FarmVille, CityVille,
FrontierVille, Zynga Poker
and CastleVille were due to overall decay rate in bookings and audience metrics in these games. The decreases in
online game revenue were partially offset by increases in online game revenue of $118.0 million and $32.9 million from FarmVille 2 and
ChefVille , respectively, which were the result of the launch of these games in September 2012 and August 2012, respectively. All other games
accounted for the remaining net decrease of $96.4 million.
International revenue as a percentage of total revenue was 40% and 41% in 2013 and 2012, respectively.
In 2013, Zynga Poker, FarmVille 2 and FarmVille were our top three revenue-generating games and comprised 21%, 17%, and 16%,
respectively, of our online game revenue for the period. No other game generated more than 10% of online game revenue during the year.
Consumable virtual goods accounted for 29% and 30% of online game revenue 2013 and 2012, respectively. Durable virtual goods
accounted for 71% and 70% of online game revenue in 2013 and 2012, respectively. The estimated weighted-average life of durable virtual
goods was 12 months in 2013 and 2012. Changes in our estimated average life of durable virtual goods during the twelve months ended
December 31, 2013 for various games resulted in an increase in revenue, income from continuing operations and net income of $12.3 million,
which is the result of adjusting the remaining recognition period of deferred revenue generated in prior periods at the time of a change in
estimate. These changes in estimates resulted in a $0.01 increase in our reported earnings per share for the year ended December 31, 2013. For
2012, changes in our estimated average life of durable virtual goods resulted in an increase in revenue, income from continuing operations and
net income of $14.1 million. These changes in estimates resulted in a $0.01 increase in our reported earnings per share for the year ended
December 31, 2012.
Advertising revenue decreased $23.3 million from 2012 to 2013, due to a $14.1 million decrease in in-game sponsorships, a $6.0 million
decrease in in-game offers, engagement ads and other advertising revenue and a $3.4 million decrease in licensing revenue, offset by an increase
of $0.2 million from in-game display ads. These declines may be attributed to declines in our DAUs in 2013.
Cost of revenue
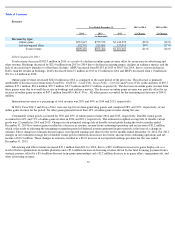
2014 Compared to 2013.
Cost of revenue decreased $34.8 million in the twelve months ended December 31, 2014 as compared to the same
period of the prior year. The decrease was primarily attributable to a $38.1 million decrease in depreciation expense due to the consolidation of
data center facilities and the related disposition of certain data center assets in prior periods, a $23.1 million decrease in hosting and data center
costs due to lower
58
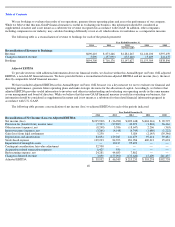
Year Ended December 31,
2013 to 2014
% Change
2012 to 2013
% Change
2014
2013
2012
(in thousands)
Cost of revenue
$
213,570
$
248,358
$
352,169
(14
)%
(29
)%