Zynga 2014 Annual Report Download - page 93
Download and view the complete annual report
Please find page 93 of the 2014 Zynga annual report below. You can navigate through the pages in the report by either clicking on the pages listed below, or by using the keyword search tool below to find specific information within the annual report.-
 1
1 -
2
-
3
-
4
-
5
-
6
-
7
-
8
-
9
-
10
-
11
-
12
-
13
-
14
-
15
-
16
-
17
-
18
-
19
-
20
-
21
-
22
-
23
-
24
-
25
-
26
-
27
-
28
-
29
-
30
-
31
-
32
-
33
-
34
-
35
-
36
-
37
-
38
-
39
-
40
-
41
-
42
-
43
-
44
-
45
-
46
-
47
-
48
-
49
-
50
-
51
-
52
-
53
-
54
-
55
-
56
-
57
-
58
-
59
-
60
-
61
-
62
-
63
-
64
-
65
-
66
-
67
-
68
-
69
-
70
-
71
-
72
-
73
-
74
-
75
-
76
-
77
-
78
-
79
-
80
-
81
-
82
-
 83
83 -
 84
84 -
 85
85 -
 86
86 -
 87
87 -
 88
88 -
 89
89 -
 90
90 -
 91
91 -
 92
92 -
 93
93 -
 94
94 -
 95
95 -
 96
96 -
 97
97 -
 98
98 -
 99
99 -
 100
100 -
 101
101 -
 102
102 -
 103
103 -
104
-
105
-
106
-
107
-
108
-
109
-
110
-
111
-
112
-
113
-
114
-
115
-
116
-
117
-
118
-
119
-
120
-
121
-
122
-
123
-
124
-
125
 |
 |

Table of Contents
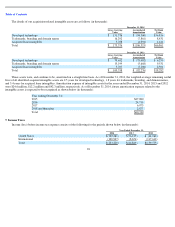
4. Property and Equipment
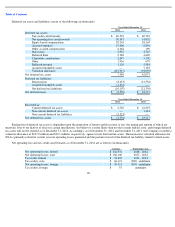
Property and equipment consist of the following (in thousands):
Changes in Estimated Life
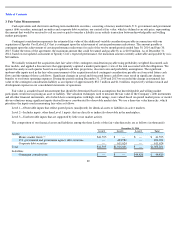
In the third quarter of 2013, due to changing longer term capacity needs and our focus on driving efficiencies, we changed our estimate of
the remaining economic life of certain computer equipment and leasehold improvements in one of our data centers that had a carrying value of
$11.9 million as of June 30, 2013 from approximately eleven months to approximately four months. As a result of this change in estimate, we
recorded $5.3 million of incremental depreciation expense in 2013, and recorded a gain of $1.5 million within other income (expense) in our
consolidated statements of operations upon selling these assets in the fourth quarter of 2013. The net effect of these changes was a $5.3 million
decrease in income from operations, a $3.8 million decrease in net income and no impact on reported earnings per share.
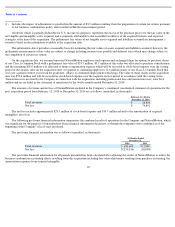
In the fourth quarter of 2013, we also changed our estimate of the remaining economic life of certain computer equipment and leasehold
improvements in two of our data centers, from approximately ten months to approximately five months. The carrying value of these assets as of
September 30, 2013 was $27.1 million and as of December 31, 2013 was $14.6 million. As a result of this change in estimate, we recorded $4.9
million of incremental depreciation expense in the fourth quarter of 2013 resulting in a $4.9 million decrease in income from continuing
operations and net income and no impact on reported earnings per share. As a result of the change in the fourth quarter of 2013, we recognized
further incremental depreciation of $2.6 million during 2014 resulting in $2.6 million decrease in income from continuing operations and net
income and no impact on reported earnings per share.
90
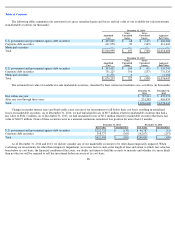
December 31, 2013
Level 1
Level 2
Level 3
Total
Assets:
Money market funds
$
349,421
$
—
$
—
$
349,421
U.S. government and government agency debt securities
—
333,741
—
333,741
Corporate debt securities
—
731,324
—
731,324
Municipal securities
—
11,382
—
11,382
Total
$
349,421
$
1,076,447
$
—
$
1,425,868
Liabilities
Contingent consideration
$
—
$
—
$
11,720
$
11,720
Includes amounts classified as cash and cash equivalents.
December 31,
2014
December 31,
2013
Computer equipment
$
141,946
$
225,063
Software
31,778
27,668
Land
89,130
89,130
Building
194,574
192,512
Furniture and fixtures
10,616
11,303
Leasehold improvements
9,694
11,695
477,738
557,371
Less accumulated depreciation
(179,819
)
(208,578
)
Total property and equipment, net
$
297,919
$
348,793
(1)
(1)
(1)