Zynga 2014 Annual Report Download - page 50
Download and view the complete annual report
Please find page 50 of the 2014 Zynga annual report below. You can navigate through the pages in the report by either clicking on the pages listed below, or by using the keyword search tool below to find specific information within the annual report.-
 1
1 -
2
-
3
-
4
-
5
-
6
-
7
-
8
-
9
-
10
-
11
-
12
-
13
-
14
-
15
-
16
-
17
-
18
-
19
-
20
-
21
-
22
-
23
-
24
-
25
-
26
-
27
-
28
-
29
-
30
-
31
-
32
-
33
-
34
-
35
-
36
-
37
-
38
-
39
-
 40
40 -
 41
41 -
 42
42 -
 43
43 -
 44
44 -
 45
45 -
 46
46 -
 47
47 -
 48
48 -
 49
49 -
 50
50 -
 51
51 -
 52
52 -
 53
53 -
 54
54 -
 55
55 -
 56
56 -
 57
57 -
 58
58 -
 59
59 -
 60
60 -
61
-
62
-
63
-
64
-
65
-
66
-
67
-
68
-
69
-
70
-
71
-
72
-
73
-
74
-
75
-
76
-
77
-
78
-
79
-
80
-
81
-
82
-
83
-
84
-
85
-
86
-
87
-
88
-
89
-
90
-
91
-
92
-
93
-
94
-
95
-
96
-
97
-
98
-
99
-
100
-
101
-
102
-
103
-
104
-
105
-
106
-
107
-
108
-
109
-
110
-
111
-
112
-
113
-
114
-
115
-
116
-
117
-
118
-
119
-
120
-
121
-
122
-
123
-
124
-
125
 |
 |

Table of Contents
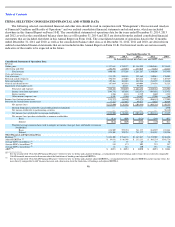
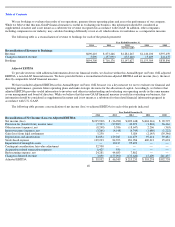
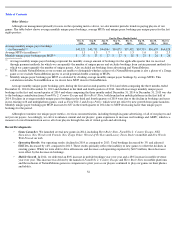
Stock-based expense included in the statements of operations data above was as follows:
Non-GAAP Financial Measures
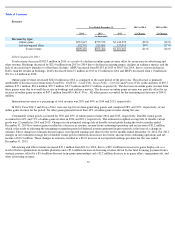
Bookings
To provide investors with additional information about our financial results, we disclose within this Annual Report on Form 10-K,
bookings, a non-GAAP financial measure. We have provided below a reconciliation between bookings and revenue, the most directly
comparable GAAP financial measure.
Bookings is a non-GAAP financial measure that is equal to revenue recognized during the period plus the change in deferred revenue
during the period. We record the sale of virtual goods and mobile downloads as deferred revenue and then recognize that revenue over the
estimated average payer life or as virtual goods are consumed. Advertising sales that consist of certain branded virtual goods and sponsorships
are also deferred and recognized over the estimated average life of the branded virtual good, similar to online game revenue. For additional
discussion of the estimated average life of durable virtual goods, see the section titled “Management’s Discussion and Analysis of Financial
Condition and Results of Operations—Revenue Recognition” elsewhere in this Annual Report on Form 10-K.
47
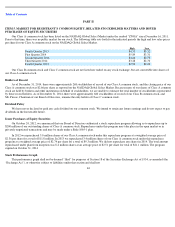
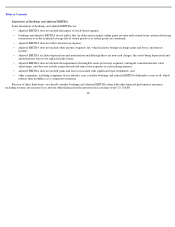
DAUs is the number of individuals who played one of our games during a particular day, as recorded by our internal analytics systems. Average DAUs is the average of the DAUs for
each day during the period reported. See the section titled “Management’s Discussion and Analysis of Financial Condition and Results of Operations—Key Metrics—Key Operating
Metrics
—
DAUs
”
for more information on how we define and calculate DAUs.
MAUs is the number of individuals who played a particular game during a 30-day-period, as recorded by our internal analytics systems. Average MAUs is the average of the MAUs at
each month-end during the period reported. See the section titled “Management’s Discussion and Analysis of Financial Condition and Results of Operations—Key Metrics—Key
Operating Metrics
—
MAUs
”
for more information on how we define and calculate MAUs.
MUUs is the number of unique individuals who played any of our games on a particular platform during a 30-
day period, as recorded by our internal analytics systems. Average MUUs is
the average of the MUUs at each month-
end during the period reported. MUUs exclude NaturalMotion as our systems are unable to distinguish whether a player of a NaturalMotion game
is also a player of a Zynga game so we exclude NaturalMotion payers to avoid potential double counting of MUUs. See the section titled “Management’s Discussion and Analysis of
Financial Condition and Results of Operations
—
Key Metrics
—
Key Operating Metrics
—
MUUs
”
for more information on how we define and calculate MUUs.
ABPU is defined as (i) our total bookings in a given period, divided by (ii) the number of days in that period, divided by (iii) the average DAUs during the period. See the section titled
“Management’s Discussion and Analysis of Financial Condition and Results of Operations—Key Metrics—Key Operating Metrics—ABPU” for more information on how we define and
calculate ABPU.
Year Ended December 31,
2014
2013
2012
2011
2010
Cost of revenue
$
4,623
$
468
$
12,116
$
17,660
$
2,128
Research and development
83,673
61,931
200,640
374,920
10,242
Sales and marketing
5,927
8,079
24,684
81,326
7,899
General and administrative
35,010
13,915
44,546
126,306
5,425
Total stock
-
based compensation
$
129,233
$
84,393
$
281,986
$
600,212
$
25,694
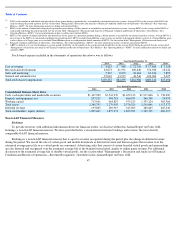
Year Ended December 31,
2014
2013
2012
2011
2010
Consolidated Balance Sheet Data:
Cash, cash equivalents and marketable securities
$
1,147,909
$
1,541,970
$
1,652,313
$
1,917,606
$
738,090
Property and equipment, net
297,919
348,793
466,074
246,740
74,959
Working capital
713,901
964,897
975,225
1,355,224
385,564
Total assets
2,348,793
2,279,085
2,576,320
2,516,646
1,112,572
Deferred revenue
193,805
189,915
347,005
480,645
465,236
Total stockholders
’
equity (deficit)
1,895,692
1,877,271
1,825,503
1,749,539
482,215
(3)
(4)
(5)
(6)