Zynga 2012 Annual Report Download - page 90
Download and view the complete annual report
Please find page 90 of the 2012 Zynga annual report below. You can navigate through the pages in the report by either clicking on the pages listed below, or by using the keyword search tool below to find specific information within the annual report.-
 1
1 -
2
-
3
-
4
-
5
-
6
-
7
-
8
-
9
-
10
-
11
-
12
-
13
-
14
-
15
-
16
-
17
-
18
-
19
-
20
-
21
-
22
-
23
-
24
-
25
-
26
-
27
-
28
-
29
-
30
-
31
-
32
-
33
-
34
-
35
-
36
-
37
-
38
-
39
-
40
-
41
-
42
-
43
-
44
-
45
-
46
-
47
-
48
-
49
-
50
-
51
-
52
-
53
-
54
-
55
-
56
-
57
-
58
-
59
-
60
-
61
-
62
-
63
-
64
-
65
-
66
-
67
-
68
-
69
-
70
-
71
-
72
-
73
-
74
-
75
-
76
-
77
-
78
-
79
-
 80
80 -
 81
81 -
 82
82 -
 83
83 -
 84
84 -
 85
85 -
 86
86 -
 87
87 -
 88
88 -
 89
89 -
 90
90 -
 91
91 -
 92
92 -
 93
93 -
 94
94 -
 95
95 -
 96
96 -
 97
97 -
 98
98 -
 99
99 -
 100
100 -
101
-
102
-
103
-
104
-
105
-
106
-
107
-
108
-
109
-
110
-
111
-
112
-
113
-
114
-
115
-
116
-
117
-
118
-
119
-
120
-
121
-
122
 |
 |

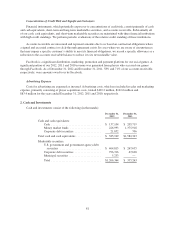
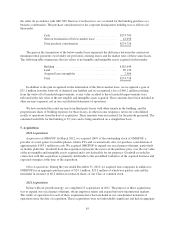
The following tables summarize our amortized cost, gross unrealized gains and losses and fair value of our
available-for-sale investments in marketable securities (in thousands):
December 31, 2012
Amortized
Cost
Gross
Unrealized
Gains
Gross
Unrealized
Losses
Aggregate
Fair Value
U.S. government and government agency debt
securities ............................ $ 464,517 $303 $ (5) $ 464,815
Corporate debt securities .................. 795,962 524 (170) 796,316
Municipal securities ..................... 5,234 — (1) 5,233
Total .................................. $1,265,713 $827 $(176) $1,266,364
December 31, 2011
Amortized
Cost
Gross
Unrealized
Gains
Gross
Unrealized
Losses
Aggregate
Fair Value
U.S. government and government agency debt
securities ............................ $ 267,635 $ 53 $ (53) $ 267,635
Corporate debt securities .................. 67,657 35 (64) 67,628
Total .................................. $ 335,292 $ 88 $(117) $ 335,263
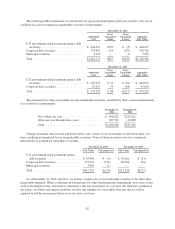
The estimated fair value of available-for-sale marketable securities, classified by their contractual maturities
was as follows (in thousands):
December 31,
2012
December 31,
2011
Due within one year .......................... $ 898,821 $225,165
After one year through three years ............... 367,543 110,098
Total ...................................... $1,266,364 $335,263
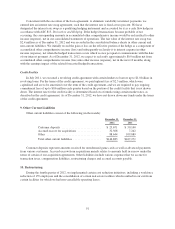
Changes in market interest rates and bond yields cause certain of our investments to fall below their cost
basis, resulting in unrealized losses on marketable securities. None of these securities were in a continuous
unrealized loss position for more than 12 months.
December 31, 2012 December 31, 2011
Fair Value Unrealized loss Fair Value Unrealized loss
U.S. government and government agency
debt securities ..................... $ 43,404 $ (5) $ 70,162 $ (53)
Corporate debt securities ............... 371,243 (170) 40,964 (64)
Municipal securities ................... 3,063 (1) — —
Total ............................... $417,710 $(176) $111,126 $(117)
As of December 31, 2012 and 2011, we did not consider any of our marketable securities to be other-than-
temporarily impaired. When evaluating our investments for other-than-temporary impairment, we review factors
such as the length of time and extent to which fair value has been below its cost basis, the financial condition of
the issuer, our ability and intent to hold the security and whether it is more likely than not that we will be
required to sell the investment before recovery of its cost basis.
82