Zynga 2012 Annual Report Download - page 51
Download and view the complete annual report
Please find page 51 of the 2012 Zynga annual report below. You can navigate through the pages in the report by either clicking on the pages listed below, or by using the keyword search tool below to find specific information within the annual report.-
 1
1 -
2
-
3
-
4
-
5
-
6
-
7
-
8
-
9
-
10
-
11
-
12
-
13
-
14
-
15
-
16
-
17
-
18
-
19
-
20
-
21
-
22
-
23
-
24
-
25
-
26
-
27
-
28
-
29
-
30
-
31
-
32
-
33
-
34
-
35
-
36
-
37
-
38
-
39
-
40
-
 41
41 -
 42
42 -
 43
43 -
 44
44 -
 45
45 -
 46
46 -
 47
47 -
 48
48 -
 49
49 -
 50
50 -
 51
51 -
 52
52 -
 53
53 -
 54
54 -
 55
55 -
 56
56 -
 57
57 -
 58
58 -
 59
59 -
 60
60 -
 61
61 -
62
-
63
-
64
-
65
-
66
-
67
-
68
-
69
-
70
-
71
-
72
-
73
-
74
-
75
-
76
-
77
-
78
-
79
-
80
-
81
-
82
-
83
-
84
-
85
-
86
-
87
-
88
-
89
-
90
-
91
-
92
-
93
-
94
-
95
-
96
-
97
-
98
-
99
-
100
-
101
-
102
-
103
-
104
-
105
-
106
-
107
-
108
-
109
-
110
-
111
-
112
-
113
-
114
-
115
-
116
-
117
-
118
-
119
-
120
-
121
-
122
 |
 |

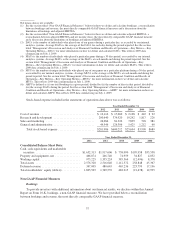
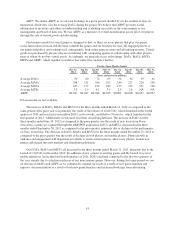
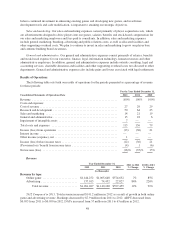
ABPU. We define ABPU as (i) our total bookings in a given period, divided by (ii) the number of days in
that period, divided by, (iii) the average DAUs during the period. We believe that ABPU provides useful
information to investors and others in understanding and evaluating our results in the same manner as our
management and board of directors. We use ABPU as a measure of overall monetization across all of our players
through the sale of virtual goods and advertising.
Our business model for social games is designed so that, as there are more players that play our games,
social interactions increase and the more valuable the games and our business become. All engaged players of
our games help drive our bookings and, consequently, both online game revenue and advertising revenue. Virtual
goods are purchased by players who are socializing with, competing against or collaborating with other players,
most of whom do not buy virtual goods. Accordingly, we primarily focus on bookings, DAUs, MAUs, MUUs,
MUPs and ABPU, which together we believe best reflect key audience metrics.
For the Three Months Ended
Dec 31,
2012
Sep 30,
2012
Jun 30,
2012
Mar 31,
2012
Dec 31,
2011
Sep 30,
2011
Jun 30,
2011
Mar 31,
2011
(users and payers in millions)
Average DAUs .................. 56 60 72 65 54 54 59 62
Average MAUs .................. 298 311 306 292 240 227 228 236
Average MUUs .................. 167 177 192 182 153 152 151 146
Average MUPs .................. 2.9 2.9 4.1 3.5 2.9 2.6 NA NA
ABPU ......................... $0.051 $0.047 $0.046 $0.055 $0.061 $0.058 $0.051 $0.051
NA means data is not available.
The increase in DAUs, MAUs and MUUs for the three months ended March 31, 2012 as compared to the
same period of the prior year was primarily the result of the release of CastleVille, which launched in the fourth
quarter of 2011 and reached seven million DAUs in two weeks, and Hidden Chronicles, which launched in the
first quarter of 2012. Additionally we released four titles on mobile platforms. The increase in DAUs for the
three months ended June 30, 2012 as compared to the prior quarter was the result of new users from Draw
Something, a game we acquired through the OMGPOP acquisition. DAUs and MUUs decreased in the three
months ended September 30, 2012 as compared to the prior quarter, primarily due to declines in the performance
of Draw Something. The decrease in DAUs, MAUs and MUUs for the three months ended December 31, 2012 as
compared to the prior quarter was the result of declines in web players and mobile players. Future growth in
audience and engagement will depend on our ability to retain current players, attract new players, launch new
games and expand into new markets and distribution platforms.
Our DAUs, MAUs and MUUs all increased in the three months ended March 31, 2011, primarily due to the
launch of CityVille in December 2010, the addition of new content to existing games and the launch of several
mobile initiatives. In the third and fourth quarters of 2011, DAUs declined compared to the first two quarters of
the year, mainly due to a decline in players of our more mature games. However, during that same period we saw
an increase in MAUs and ABPU as we continued to expand our reach as a result of new game launches and
improve our monetization as a result of both new game launches and increased bookings from advertising.
43