Zynga 2012 Annual Report Download - page 58
Download and view the complete annual report
Please find page 58 of the 2012 Zynga annual report below. You can navigate through the pages in the report by either clicking on the pages listed below, or by using the keyword search tool below to find specific information within the annual report.-
 1
1 -
2
-
3
-
4
-
5
-
6
-
7
-
8
-
9
-
10
-
11
-
12
-
13
-
14
-
15
-
16
-
17
-
18
-
19
-
20
-
21
-
22
-
23
-
24
-
25
-
26
-
27
-
28
-
29
-
30
-
31
-
32
-
33
-
34
-
35
-
36
-
37
-
38
-
39
-
40
-
41
-
42
-
43
-
44
-
45
-
46
-
47
-
 48
48 -
 49
49 -
 50
50 -
 51
51 -
 52
52 -
 53
53 -
 54
54 -
 55
55 -
 56
56 -
 57
57 -
 58
58 -
 59
59 -
 60
60 -
 61
61 -
 62
62 -
 63
63 -
 64
64 -
 65
65 -
 66
66 -
 67
67 -
 68
68 -
69
-
70
-
71
-
72
-
73
-
74
-
75
-
76
-
77
-
78
-
79
-
80
-
81
-
82
-
83
-
84
-
85
-
86
-
87
-
88
-
89
-
90
-
91
-
92
-
93
-
94
-
95
-
96
-
97
-
98
-
99
-
100
-
101
-
102
-
103
-
104
-
105
-
106
-
107
-
108
-
109
-
110
-
111
-
112
-
113
-
114
-
115
-
116
-
117
-
118
-
119
-
120
-
121
-
122
 |
 |

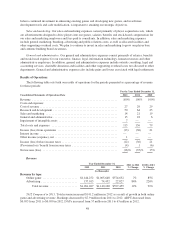
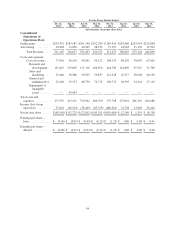
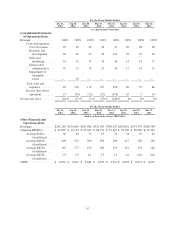
Wars,FarmVille and Zynga Poker were our top revenue-generating games and comprised 28%, 30% and 20%,
respectively, of online game revenue. No other game generated more than 10% of online game revenue during
either year.
Consumable virtual goods accounted for 29% and 37% of online game revenue in 2011 and 2010, respectively.
Revenue from consumable virtual goods accounted for 19% of the increase in online game revenue in 2011.
Durable virtual goods accounted for 71% and 63% of online game revenue in 2011 and 2010, respectively.
Revenue from durable virtual goods accounted for 81% of the increase in online game revenue in 2011. The
estimated weighted-average life of durable virtual goods for bookings was 15 months for 2011 compared to
18 months for 2010. In addition, in 2011 cumulative changes in our estimated weighted-average life of durable
virtual goods for various games resulted in a net increase in revenue of $53.9 million in 2011, which is the result
of adjusting the remaining recognition period of deferred revenue generated in prior periods at the time of the
change in estimate.
Advertising revenue increased $51.6 million in 2011, due to a $26.0 million increase in revenue from in-
game offers, sponsorships and engagement ads, and a $25.6 million increase in revenue from other advertising
activity. Revenue from in-game offers, sponsorships and engagement ads increased in part due to a higher level
of in-game offers during 2011, reflecting in part the fact that we discontinued certain in-game offers in the fourth
quarter of 2009 and resumed and gradually increased in-game offers during the year ended December 31, 2010
but did not have in-game offers for the entire year.
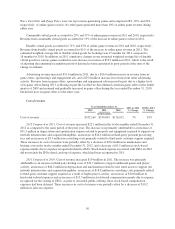
Cost of revenue
Year Ended December 31, 2011 to 2012
% Change
2010 to 2011
% Change2012 2011 2010
(in thousands)
Cost of revenue ............................ $352,169 $330,043 $176,052 7% 87%
2012 Compared to 2011. Cost of revenue increased $22.1 million in the twelve months ended December 31,
2012 as compared to the same period of the prior year. The increase was primarily attributable to an increase of
$31.5 million in depreciation and amortization expense related to property and equipment acquired to support our
network infrastructure and acquired intangibles, an increase of $24.6 million in third-party payment processing
fees and an increase of $5.3 million in consulting costs primarily related to third-party customer support required.
These increases in costs of revenue were partially offset by a decrease of $30.4 million in maintenance and
hosting costs in the twelve months ended December 31, 2012, and a decrease of $5.5 million in stock-based
expense mainly due to expense recognized related to ZSUs. Stock-based expense associated with ZSUs in 2012
did not include the IPO related catch-up of expense, which had been recognized in 2011.
2011 Compared to 2010. Cost of revenue increased $154 million in 2011. The increase was primarily
attributable to an increase in third party hosting costs of $72.7 million to support additional games and player
activity, an increase of $44.2 million in depreciation and amortization related to new fixed assets to support our
network infrastructure and acquired intangibles, an increase of $18.8 million in consulting costs primarily related
to third-party customer support required as a result of higher player activity, an increase of $10.8 million in
headcount-related expenses and an increase of $15.5 million in stock-based compensation mainly due to expense
recognized for the vesting of ZSUs, as prior to our initial public offering, these stock-based compensation
expenses had been deferred. These increases in costs of revenue were partially offset by a decrease of $10.2
million in sales tax expense.
50