Zynga 2012 Annual Report Download - page 105
Download and view the complete annual report
Please find page 105 of the 2012 Zynga annual report below. You can navigate through the pages in the report by either clicking on the pages listed below, or by using the keyword search tool below to find specific information within the annual report.-
 1
1 -
2
-
3
-
4
-
5
-
6
-
7
-
8
-
9
-
10
-
11
-
12
-
13
-
14
-
15
-
16
-
17
-
18
-
19
-
20
-
21
-
22
-
23
-
24
-
25
-
26
-
27
-
28
-
29
-
30
-
31
-
32
-
33
-
34
-
35
-
36
-
37
-
38
-
39
-
40
-
41
-
42
-
43
-
44
-
45
-
46
-
47
-
48
-
49
-
50
-
51
-
52
-
53
-
54
-
55
-
56
-
57
-
58
-
59
-
60
-
61
-
62
-
63
-
64
-
65
-
66
-
67
-
68
-
69
-
70
-
71
-
72
-
73
-
74
-
75
-
76
-
77
-
78
-
79
-
80
-
81
-
82
-
83
-
84
-
85
-
86
-
87
-
88
-
89
-
90
-
91
-
92
-
93
-
94
-
 95
95 -
 96
96 -
 97
97 -
 98
98 -
 99
99 -
 100
100 -
 101
101 -
 102
102 -
 103
103 -
 104
104 -
 105
105 -
 106
106 -
 107
107 -
 108
108 -
 109
109 -
 110
110 -
 111
111 -
 112
112 -
 113
113 -
 114
114 -
 115
115 -
116
-
117
-
118
-
119
-
120
-
121
-
122
 |
 |

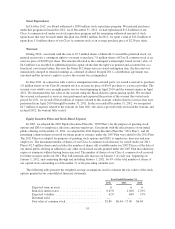
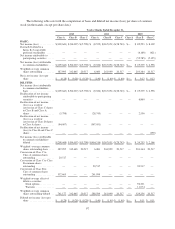
The following table sets forth the computation of basic and diluted net income (loss) per share of common
stock (in thousands, except per share data):
Twelve Months Ended December 31,
2012 2011 2010
Class A Class B Class C Class A Class B Class C Class A Class B Class C
BASIC:
Net income (loss) ........... $(109,643) $ (94,007) $ (5,798) $ (8,522) $(367,051) $(28,743) $— $ 82,293 $ 8,302
Deemed dividend to a
Series B-2 convertible
preferred stockholder ...... — — — — — — — (4,169) (421)
Net income attributable to
participating securities ..... — — — — — — — (52,785) (5,325)
Net income (loss) attributable
to common stockholders .... $(109,643) $ (94,007) $ (5,798) $ (8,522) $(367,051) $(28,743) $— $ 25,339 $ 2,556
Weighted-average common
shares outstanding ......... 387,995 332,665 20,517 6,083 261,999 20,517 — 203,364 20,517
Basic net income (loss) per
share ................... $ (0.28) $ (0.28) $ (0.28) $ (1.40) $ (1.40) $ (1.40) $— $ 0.12 $ 0.12
DILUTED:
Net income (loss) attributable
to common stockholders-
basic ................... $(109,643) $ (94,007) $ (5,798) $ (8,522) $(367,051) $(28,743) $— $ 25,339 $ 2,556
Reallocation of net income
attributable to participating
securities ................ — — — — — — — 6,860 —
Reallocation of net income
(loss) as a result of
conversion of Class C shares
to Class B and Class A
shares ................... (5,798) — — (28,743) — — — 2,556 —
Reallocation of net income
(loss) as a result of
conversion of Class B shares
to Class A shares .......... (94,007) — — (367,051) — — — — —
Reallocation of net income
(loss) to Class B and Class C
shares ................... — — — — — — — — (390)
Net income (loss) attributable
to common stockholders-
diluted .................. $(209,448) $ (94,007) $ (5,798) $(404,316) $(367,051) $(28,743) $— $ 34,755 $ 2,166
Weighted -average common
shares outstanding-basic .... 387,995 332,665 20,517 6,083 261,999 20,517 — 203,364 20,517
Conversion of Class C to
Class A common shares
outstanding .............. 20,517 — — — — — — — —
Conversion of Class C to Class
B common shares
outstanding .............. — — — 20,517 — — — 20,517 —
Conversion of Class B to
Class A common shares
outstanding .............. 332,665 — — 261,999 — — — — —
Weighted-average effect of
dilutive securities:
Stock options ........... — — — — — — — 94,301 —
Warrants .............. — — — — — — — 11,074 —
Weighted-average common
shares outstanding-diluted . . 741,177 332,665 20,517 288,599 261,999 20,517 — 329,256 20,517
Diluted net income (loss) per
share ................... $ (0.28) $ (0.28) $ (0.28) $ (1.40) $ (1.40) $ (1.40) $— $ 0.11 $ 0.11
97