Zynga 2012 Annual Report Download - page 62
Download and view the complete annual report
Please find page 62 of the 2012 Zynga annual report below. You can navigate through the pages in the report by either clicking on the pages listed below, or by using the keyword search tool below to find specific information within the annual report.-
 1
1 -
2
-
3
-
4
-
5
-
6
-
7
-
8
-
9
-
10
-
11
-
12
-
13
-
14
-
15
-
16
-
17
-
18
-
19
-
20
-
21
-
22
-
23
-
24
-
25
-
26
-
27
-
28
-
29
-
30
-
31
-
32
-
33
-
34
-
35
-
36
-
37
-
38
-
39
-
40
-
41
-
42
-
43
-
44
-
45
-
46
-
47
-
48
-
49
-
50
-
51
-
 52
52 -
 53
53 -
 54
54 -
 55
55 -
 56
56 -
 57
57 -
 58
58 -
 59
59 -
 60
60 -
 61
61 -
 62
62 -
 63
63 -
 64
64 -
 65
65 -
 66
66 -
 67
67 -
 68
68 -
 69
69 -
 70
70 -
 71
71 -
 72
72 -
73
-
74
-
75
-
76
-
77
-
78
-
79
-
80
-
81
-
82
-
83
-
84
-
85
-
86
-
87
-
88
-
89
-
90
-
91
-
92
-
93
-
94
-
95
-
96
-
97
-
98
-
99
-
100
-
101
-
102
-
103
-
104
-
105
-
106
-
107
-
108
-
109
-
110
-
111
-
112
-
113
-
114
-
115
-
116
-
117
-
118
-
119
-
120
-
121
-
122
 |
 |

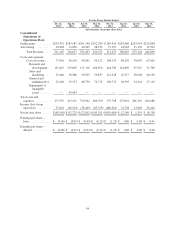
For the Three Months Ended
Dec 31,
2012
Sep 30,
2012
Jun 30,
2012
Mar 31,
2012
Dec 31,
2011
Sep 30,
2011
Jun 30,
2011
Mar 31,
2011
(in thousands, except per share data)
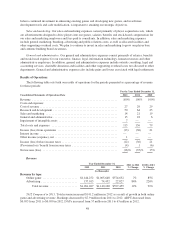
Consolidated
Statements of
Operations Data:
Online game .......... $274,337 $285,587 $291,548 $292,780 $ 283,910 $287,866 $263,974 $229,898
Advertising ........... 36,828 31,050 40,945 28,192 27,327 18,963 15,170 12,992
Total Revenue ..... 311,165 316,637 332,493 320,972 311,237 306,829 279,144 242,890
Costs and expenses:
Cost of revenue .... 77,056 90,150 94,841 90,122 104,135 80,170 78,076 67,662
Research and
development . . 131,847 155,609 171,316 186,876 444,702 114,809 95,747 71,760
Sales and
marketing .... 32,446 36,586 56,055 56,837 112,228 43,717 38,098 40,156
General and
administrative . 32,206 35,353 48,730 72,715 136,733 36,395 54,218 27,110
Impairment of
intangible
assets ........ — 95,493 — — ————
Total costs and
expenses ........... 273,555 413,191 370,942 406,550 797,798 275,091 266,139 206,688
Income (loss) from
operations .......... 37,610 (96,554) (38,449) (85,578) (486,561) 31,738 13,005 36,202
Net income (loss) ...... $(48,561) $ (52,725) $ (22,811) $ (85,351) $(435,005) $ 12,540 $ 1,391 $ 16,758
Earnings per share—
basic .............. $ (0.06) $ (0.07) $ (0.03) $ (0.12) $ (1.22) $ 0.00 $ 0.00 $ 0.01
Earnings per share—
diluted ............. $ (0.06) $ (0.07) $ (0.03) $ (0.12) $ (1.22) $ 0.00 $ 0.00 $ 0.00
54