Zynga 2012 Annual Report Download - page 63
Download and view the complete annual report
Please find page 63 of the 2012 Zynga annual report below. You can navigate through the pages in the report by either clicking on the pages listed below, or by using the keyword search tool below to find specific information within the annual report.
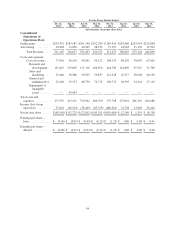
For the Three Months Ended
Dec 31,
2012
Sep 30,
2012
Jun 30,
2012
Mar 31,
2012
Dec 31,
2011
Sep 30,
2011
Jun 30,
2011
Mar 31,
2011
(as a percentage of revenue)
Consolidated Statements
of Operations Data:
Revenue ............... 100% 100% 100% 100% 100% 100% 100% 100%
Costs and expenses:
Cost of revenue . . . 25 28 29 28 33 26 28 28
Research and
development . . . 42 49 52 58 143 38 34 30
Sales and
marketing ...... 10 12 17 18 36 14 14 17
General and
administrative . . 10 11 14 23 44 12 19 11
Impairment of
intangible
assets ......... — 30 — — — — — —
Total costs and
expenses ........ 87 130 112 127 256 90 95 86
Income (loss) from
operations ....... 13 (30) (12) (27) (156) 10 5 14
Net income (loss) ....... (16)% (17)% (7)% (27)% (140)% 4% 0% 6%
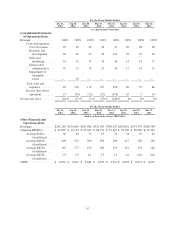
For the Three Months Ended
Dec 31,
2012
Sep 30,
2012
Jun 30,
2012
Mar 31,
2012
Dec 31,
2011
Sep 30,
2011
Jun 30,
2011
Mar 31,
2011
(dollars in thousands, except ABPU data)
Other Financial and
Operations Data:
Bookings .............. $261,269 $255,606 $301,588 $329,164 $306,507 $287,661 $274,743 $286,598
Adjusted EBITDA ....... $ 45,018 $ 16,154 $ 65,309 $ 86,752 $ 67,801 $ 58,130 $ 65,080 $112,263
Average DAUs 56 60 72 65 54 54 59 62
(in millions) ....
Average MAUs 298 311 306 292 240 227 228 236
(in millions) ....
Average MUUs 167 177 192 182 153 152 151 146
(in millions) ....
Average MUPs 2.9 2.9 4.1 3.5 2.9 2.6 NA NA
(in millions) ....
ABPU ................ $ 0.051 $ 0.047 $ 0.046 $ 0.055 $ 0.061 $ 0.058 $ 0.051 $ 0.051
55


