Zynga 2012 Annual Report Download - page 59
Download and view the complete annual report
Please find page 59 of the 2012 Zynga annual report below. You can navigate through the pages in the report by either clicking on the pages listed below, or by using the keyword search tool below to find specific information within the annual report.-
 1
1 -
2
-
3
-
4
-
5
-
6
-
7
-
8
-
9
-
10
-
11
-
12
-
13
-
14
-
15
-
16
-
17
-
18
-
19
-
20
-
21
-
22
-
23
-
24
-
25
-
26
-
27
-
28
-
29
-
30
-
31
-
32
-
33
-
34
-
35
-
36
-
37
-
38
-
39
-
40
-
41
-
42
-
43
-
44
-
45
-
46
-
47
-
48
-
 49
49 -
 50
50 -
 51
51 -
 52
52 -
 53
53 -
 54
54 -
 55
55 -
 56
56 -
 57
57 -
 58
58 -
 59
59 -
 60
60 -
 61
61 -
 62
62 -
 63
63 -
 64
64 -
 65
65 -
 66
66 -
 67
67 -
 68
68 -
 69
69 -
70
-
71
-
72
-
73
-
74
-
75
-
76
-
77
-
78
-
79
-
80
-
81
-
82
-
83
-
84
-
85
-
86
-
87
-
88
-
89
-
90
-
91
-
92
-
93
-
94
-
95
-
96
-
97
-
98
-
99
-
100
-
101
-
102
-
103
-
104
-
105
-
106
-
107
-
108
-
109
-
110
-
111
-
112
-
113
-
114
-
115
-
116
-
117
-
118
-
119
-
120
-
121
-
122
 |
 |

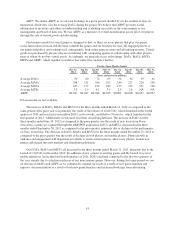
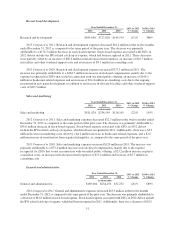
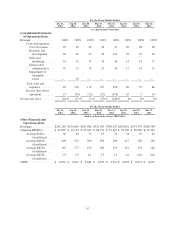
Research and development
Year Ended December 31, 2011 to 2012
% Change
2010 to 2011
% Change2012 2011 2010
(in thousands)
Research and development .................... $645,648 $727,018 $149,519 (11)% 386%
2012 Compared to 2011. Research and development expenses decreased $81.4 million in the twelve months
ended December 31, 2012 as compared to the same period of the prior year. The decrease was primarily
attributable to a $174.3 million decrease in stock-based expense. Stock-based expense associated with ZSUs in
2012 did not include the IPO related catch-up of expense, which had been recognized in 2011. These decreases
were partially offset by an increase of $66.2 million in headcount-related expenses, an increase of $10.7 million
in facilities and other overhead support costs and an increase of $8.1 million in consulting costs.
2011 Compared to 2010. Research and development expenses increased $577.5 million in 2011. The
increase was primarily attributable to a $364.7 million increase in stock-based compensation, mainly due to the
expense recognized for ZSUs that vested in connection with our initial public offering, an increase of $164.1
million in headcount-related expenses and an increase of $24.4 million in consulting costs due to the ongoing
investment in new game development, in addition to an increase in allocated facilities and other overhead support
costs of $19.7 million.
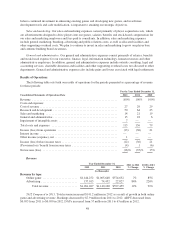
Sales and marketing
Year Ended December 31, 2011 to 2012
% Change
2010 to 2011
% Change2012 2011 2010
(in thousands)
Sales and marketing ......................... $181,924 $234,199 $114,165 (22)% 105%
2012 Compared to 2011. Sales and marketing expenses decreased $52.3 million in the twelve months ended
December 31, 2012 as compared to the same period of the prior year. The decrease was primarily attributable to
$56.6 million decrease in stock-based expense. Stock-based expense associated with ZSUs in 2012 did not
include the IPO related catch-up of expense, which had been recognized in 2011. Additionally, there was a $3.5
million decrease in marketing costs offset by a $4.2 million increase in headcount-related expenses, and a $2.6
million increase in amortization from acquired intangibles, as compared to the same period of the prior year.
2011 Compared to 2010. Sales and marketing expenses increased $120 million in 2011. The increase was
primarily attributable to a $73.4 million increase in stock-based compensation, mainly due to the expense
recognized for ZSUs that vested in connection with our initial public offering, a $23.2 million increase in player
acquisition costs, an increase in headcount-related expenses of $13.4 million and increase of $5.7 million in
consulting costs.
General and administrative
Year Ended December 31, 2011 to 2012
% Change
2010 to 2011
% Change2012 2011 2010
(in thousands)
General and administrative .................... $189,004 $254,456 $32,251 (26)% 689%
2012 Compared to 2011. General and administrative expenses decreased $65.5 million in the twelve months
ended December 31, 2012 as compared to the same period of the prior year. The decrease was primarily attributable to
a decrease of $81.8 million in stock-based expense. Stock-based expense associated with ZSUs in 2012 did not include
the IPO related catch-up of expense, which had been recognized in 2011. Additionally, there was a decrease of $10.2
51