Zynga 2012 Annual Report Download - page 11
Download and view the complete annual report
Please find page 11 of the 2012 Zynga annual report below. You can navigate through the pages in the report by either clicking on the pages listed below, or by using the keyword search tool below to find specific information within the annual report.-
 1
1 -
 2
2 -
 3
3 -
 4
4 -
 5
5 -
 6
6 -
 7
7 -
 8
8 -
 9
9 -
 10
10 -
 11
11 -
 12
12 -
 13
13 -
 14
14 -
 15
15 -
 16
16 -
 17
17 -
 18
18 -
 19
19 -
 20
20 -
 21
21 -
 22
22 -
23
-
24
-
25
-
26
-
27
-
28
-
29
-
30
-
31
-
32
-
33
-
34
-
35
-
36
-
37
-
38
-
39
-
40
-
41
-
42
-
43
-
44
-
45
-
46
-
47
-
48
-
49
-
50
-
51
-
52
-
53
-
54
-
55
-
56
-
57
-
58
-
59
-
60
-
61
-
62
-
63
-
64
-
65
-
66
-
67
-
68
-
69
-
70
-
71
-
72
-
73
-
74
-
75
-
76
-
77
-
78
-
79
-
80
-
81
-
82
-
83
-
84
-
85
-
86
-
87
-
88
-
89
-
90
-
91
-
92
-
93
-
94
-
95
-
96
-
97
-
98
-
99
-
100
-
101
-
102
-
103
-
104
-
105
-
106
-
107
-
108
-
109
-
110
-
111
-
112
-
113
-
114
-
115
-
116
-
117
-
118
-
119
-
120
-
121
-
122
 |
 |
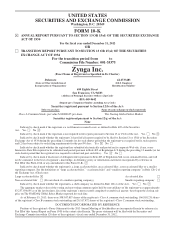
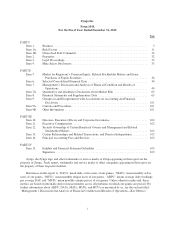
PART I
ITEM 1. BUSINESS
Overview
Zynga Inc. (“Zynga” or “we” or “the Company”) is the world’s leading provider of social game services.
We develop, market and operate online social games as live services played over the Internet and on social
networking sites and mobile platforms. Our games are accessible on Facebook and other social networks, mobile
platforms and Zynga.com. Generally, all of our games are free to play, and we generate revenue through the in-
game sale of virtual goods, mobile game download fees and advertising.
We are a pioneer and innovator of social games and a leader in making play a core activity on the Internet. We
believe our leadership position in social games is the result of our significant investment in our people, content,
brand, technology and infrastructure. Our leadership position in social games is defined by the following:
•Large and Global Community of Players. According to AppData, as of December 31, 2012, we had
five of the top 10 games on Facebook based on DAUs. Our players are also more engaged, with our
games being played by 63 million DAUs, worldwide as of December 31, 2012. According to
comScore, in the month of December 2012, players spent more time playing Zynga’s mobile games
than the next five mobile game developers combined.
•Leading Portfolio of Social Games. We have many of the most popular and successful online social
games, including the FarmVille, With Friends and Zynga Poker franchises, Bubble Safari, ChefVille,
and Draw Something. As of December 31, 2012, according to AppData, we had three of the top five
social games on Facebook based on DAUs.
•Scalable Technology and Data. We process and serve more than a petabyte of content for our players
every day, a volume of data that we believe is unmatched in the social game industry. We continually
analyze game data to optimize our games. We believe that combining data analytics with creative game
design enables us to create a superior player experience.
On mobile platforms, we have several of the most popular games, including Words With Friends,Draw
Something and Zynga Poker. In March 2012, Apple announced that Words With Friends was number three on the
25 most downloaded iOS apps of all time for the iPhone and tenth most downloaded for the iPad. In December
2012, Zynga Poker was named the top grossing App of 2012 according to the App Store chart.
We leverage our scale to increase player engagement, cross-promote our portfolio of games, continually
enhance existing games, launch new games and build the Zynga brand. We believe our scale results in network
effects that deliver compelling value to our players, and we are committed to making significant investments to
grow our community of players, their engagement and our monetization over time.
Consistent with our free-to-play business model, a small portion of our players have been payers. During the
three months ended December 31, 2012, we had approximately 2.9 million MUPs (excluding payers who use
certain payment methods for which unique payer data is not available). Because the opportunity for social
interactions increases as the number of players increases, we believe that maintaining and growing our overall
number of players, including the number of players who may not purchase virtual goods, is important to the
success of our business. As a result, we believe that the number of players who choose to purchase virtual goods
will continue to constitute a small portion of our overall players as our business grows.
Our top three games historically have contributed the majority of our revenue. Our top three games
accounted for 55%, 57% and 78% of our online game revenue in 2012, 2011 and 2010, respectively.
Our operations are headquartered in San Francisco, California, and we have several operating locations in
the U.S. as well as various international office locations in Asia and Europe. We were originally organized in
3