Zynga 2012 Annual Report Download - page 52
Download and view the complete annual report
Please find page 52 of the 2012 Zynga annual report below. You can navigate through the pages in the report by either clicking on the pages listed below, or by using the keyword search tool below to find specific information within the annual report.-
 1
1 -
2
-
3
-
4
-
5
-
6
-
7
-
8
-
9
-
10
-
11
-
12
-
13
-
14
-
15
-
16
-
17
-
18
-
19
-
20
-
21
-
22
-
23
-
24
-
25
-
26
-
27
-
28
-
29
-
30
-
31
-
32
-
33
-
34
-
35
-
36
-
37
-
38
-
39
-
40
-
41
-
 42
42 -
 43
43 -
 44
44 -
 45
45 -
 46
46 -
 47
47 -
 48
48 -
 49
49 -
 50
50 -
 51
51 -
 52
52 -
 53
53 -
 54
54 -
 55
55 -
 56
56 -
 57
57 -
 58
58 -
 59
59 -
 60
60 -
 61
61 -
 62
62 -
63
-
64
-
65
-
66
-
67
-
68
-
69
-
70
-
71
-
72
-
73
-
74
-
75
-
76
-
77
-
78
-
79
-
80
-
81
-
82
-
83
-
84
-
85
-
86
-
87
-
88
-
89
-
90
-
91
-
92
-
93
-
94
-
95
-
96
-
97
-
98
-
99
-
100
-
101
-
102
-
103
-
104
-
105
-
106
-
107
-
108
-
109
-
110
-
111
-
112
-
113
-
114
-
115
-
116
-
117
-
118
-
119
-
120
-
121
-
122
 |
 |

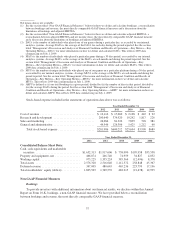
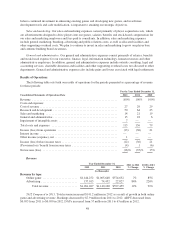
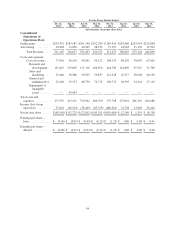
Other Metrics
Although our management primarily focuses on the operating metrics above, we also monitor periodic trends
in paying players of our games. The table below shows average monthly unique payer bookings, average MUPs and
unique payer bookings per unique payer for the last six quarters. These metrics are not available for the first and
second quarters of 2011 due to mobile payer data not becoming available until the third quarter of 2011:
For the Three Months Ended
Dec 31,
2012
Sep 30,
2012
Jun 30,
2012
Mar 31,
2012
Dec 31,
2011
Sep 30,
2011
Jun 30,
2011
Mar 31,
2011
Average monthly unique payer bookings
(in thousands)(1) ................... $72,867 $71,760 $86,282 $96,277 $90,839 $86,543 NA NA
Average MUPs (in millions) ............ 2.9 2.9 4.1 3.5 2.9 2.6 NA NA
Monthly unique payer bookings per
MUP(2) .......................... $ 25 $ 25 $ 21 $ 28 $ 31 $ 33 NA NA
NA means data is not available.
(1) Average monthly unique payer bookings represent the monthly average amount of bookings for the
applicable quarter that we received through payment methods for which we can quantify the number of
unique payers and excludes bookings generated from certain mobile payers in the first quarter of 2012 due
to our acquisition of OMGPOP late in that quarter, as well as bookings from certain payment methods for
which we cannot quantify the number of unique payers. Also excluded are bookings from advertising.
(2) Monthly unique payer bookings per MUP is calculated by dividing average monthly unique payer bookings
by average MUPs.
Average monthly unique payer bookings decreased in the second and third quarters of 2012. Monthly
unique payer bookings per MUP decreased from $28 in the first quarter of 2012 to $21 in the second quarter of
2012, due to an increase in MUPs in our mobile games, which generally monetize at a lower rate than our web
games. Monthly unique payer bookings per MUP increased to $25 in the third quarter of 2012, due to fewer
mobile MUPs. In the initial launch period of mobile games, such as the second quarter of 2012 that included the
first full quarter of new payers from Draw Something, we have seen increased MUPs due to one-time paid
download fees that tend to decline in subsequent periods after which in-game spending comprises a greater
percentage of mobile bookings.
Although we monitor our unique payer metrics, we focus on monetization, including through in-game
advertising, of all of our players and not just our payers. Accordingly, we strive to enhance content and our
players’ game experience to increase our bookings and ABPU, which is a measure of overall monetization across
all of our players through the sale of virtual goods and advertising.
Future growth in audience and engagement will depend on our ability to retain current players, attract new
players, launch new games and expand into new markets and distribution platforms, and the success of the Zynga
platform. Our operating metrics may not correlate directly to quarterly bookings or revenue trends in the short term.
Recent Developments
•Game Launches. We launched 22 games in 2012, including 11 titles on web platforms and 11 titles on
mobile platforms. In the fourth quarter of 2012, our releases included Bubble Safari Ocean,CityVille 2,
CoasterVille and The Friend Game on web platforms and Ayakashi and Party Place on mobile
platforms.
•Mobile Growth. In 2012 we saw 224% and 302% year-over-year growth in bookings and revenue,
respectively, on mobile platforms as our players continued to play our games on their phones and
tablets. In order to deliver on our mission of connecting the world through games, we are also
44