Zynga 2012 Annual Report Download - page 66
Download and view the complete annual report
Please find page 66 of the 2012 Zynga annual report below. You can navigate through the pages in the report by either clicking on the pages listed below, or by using the keyword search tool below to find specific information within the annual report.-
 1
1 -
2
-
3
-
4
-
5
-
6
-
7
-
8
-
9
-
10
-
11
-
12
-
13
-
14
-
15
-
16
-
17
-
18
-
19
-
20
-
21
-
22
-
23
-
24
-
25
-
26
-
27
-
28
-
29
-
30
-
31
-
32
-
33
-
34
-
35
-
36
-
37
-
38
-
39
-
40
-
41
-
42
-
43
-
44
-
45
-
46
-
47
-
48
-
49
-
50
-
51
-
52
-
53
-
54
-
55
-
 56
56 -
 57
57 -
 58
58 -
 59
59 -
 60
60 -
 61
61 -
 62
62 -
 63
63 -
 64
64 -
 65
65 -
 66
66 -
 67
67 -
 68
68 -
 69
69 -
 70
70 -
 71
71 -
 72
72 -
 73
73 -
 74
74 -
 75
75 -
 76
76 -
77
-
78
-
79
-
80
-
81
-
82
-
83
-
84
-
85
-
86
-
87
-
88
-
89
-
90
-
91
-
92
-
93
-
94
-
95
-
96
-
97
-
98
-
99
-
100
-
101
-
102
-
103
-
104
-
105
-
106
-
107
-
108
-
109
-
110
-
111
-
112
-
113
-
114
-
115
-
116
-
117
-
118
-
119
-
120
-
121
-
122
 |
 |

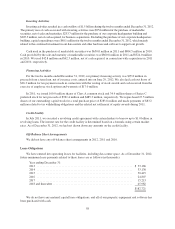
Investing Activities
Investing activities resulted in a cash outflow of $1.5 billion during the twelve months ended December 31, 2012.
The primary uses of cash associated with investing activities were $954 million for the purchase of marketable
securities, net of sales and maturities; $233.7 million for the purchase of our corporate headquarters building and
$205.5 million, net of cash acquired, for business acquisitions. Excluding the purchase of our corporate headquarters
building, capital expenditures were $98.1 million for the twelve months ended December 31, 2012, which mainly
related to the continued investment in our data centers and other hardware and software to support our growth.
Cash used in the purchase of marketable securities was $650.0 million in 2011 and $804.5 million in 2010.
Cash provided by the sale and maturity of marketable securities was $860.8 million in 2011 and $324.0 million
in 2010. We used $42.8 million and $62.3 million, net of cash acquired, in connection with acquisitions in 2011
and 2010, respectively.
Financing Activities
For the twelve months ended December 31, 2012, our primary financing activity was $99.8 million in
proceeds from a term loan, net of issuance costs, entered into on June 29, 2012. We also had cash out flows of
$26.3 million for tax payments made in connection with the vesting of stock awards and cash received from the
exercise of employee stock options and warrants of $17.0 million.
In 2011, we issued 100.0 million shares of Class A common stock and 34.9 million shares of Series C
preferred stock for net proceeds of $961.4 million and $485.3 million, respectively. We repurchased 27.5 million
shares of our outstanding capital stock for a total purchase price of $283.8 million and made payments of $83.2
million related to tax withholding obligations and the related net settlement of equity awards during 2011.
Credit Facility
In July 2011, we executed a revolving credit agreement with certain lenders to borrow up to $1.0 billion in
revolving loans. The interest rate for the credit facility is determined based on a formula using certain market
rates. As of December 31, 2012, we had not drawn down any amounts on the credit facility.
Off-Balance Sheet Arrangements
We did not have any off-balance sheet arrangements in 2012, 2011 and 2010.
Lease Obligations
We have entered into operating leases for facilities, including data center space. As of December 31, 2012,
future minimum lease payments related to these leases are as follows (in thousands):
Year ending December 31:
2013 ................................................................. $ 33,166
2014 ................................................................. 33,138
2015 ................................................................. 30,415
2016 ................................................................. 24,807
2017 ................................................................. 15,213
2018 and thereafter ...................................................... 45,982
$182,721
We do not have any material capital lease obligations, and all of our property, equipment and software has
been purchased with cash.
58