Zynga 2012 Annual Report Download - page 77
Download and view the complete annual report
Please find page 77 of the 2012 Zynga annual report below. You can navigate through the pages in the report by either clicking on the pages listed below, or by using the keyword search tool below to find specific information within the annual report.-
 1
1 -
2
-
3
-
4
-
5
-
6
-
7
-
8
-
9
-
10
-
11
-
12
-
13
-
14
-
15
-
16
-
17
-
18
-
19
-
20
-
21
-
22
-
23
-
24
-
25
-
26
-
27
-
28
-
29
-
30
-
31
-
32
-
33
-
34
-
35
-
36
-
37
-
38
-
39
-
40
-
41
-
42
-
43
-
44
-
45
-
46
-
47
-
48
-
49
-
50
-
51
-
52
-
53
-
54
-
55
-
56
-
57
-
58
-
59
-
60
-
61
-
62
-
63
-
64
-
65
-
66
-
 67
67 -
 68
68 -
 69
69 -
 70
70 -
 71
71 -
 72
72 -
 73
73 -
 74
74 -
 75
75 -
 76
76 -
 77
77 -
 78
78 -
 79
79 -
 80
80 -
 81
81 -
 82
82 -
 83
83 -
 84
84 -
 85
85 -
 86
86 -
 87
87 -
88
-
89
-
90
-
91
-
92
-
93
-
94
-
95
-
96
-
97
-
98
-
99
-
100
-
101
-
102
-
103
-
104
-
105
-
106
-
107
-
108
-
109
-
110
-
111
-
112
-
113
-
114
-
115
-
116
-
117
-
118
-
119
-
120
-
121
-
122
 |
 |

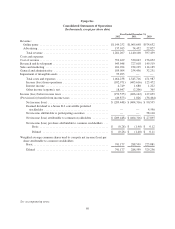
Zynga Inc.
Consolidated Statements of Operations
(In thousands, except per share data)
Year Ended December 31,
2012 2011 2010
Revenue:
Online game ............................................... $1,144,252 $1,065,648 $574,632
Advertising ................................................ 137,015 74,452 22,827
Total revenue ............................................ 1,281,267 1,140,100 597,459
Costs and expenses:
Cost of revenue ............................................... 352,169 330,043 176,052
Research and development ...................................... 645,648 727,018 149,519
Sales and marketing ........................................... 181,924 234,199 114,165
General and administrative ..................................... 189,004 254,456 32,251
Impairment of intangible assets .................................. 95,493 — —
Total costs and expenses ................................... 1,464,238 1,545,716 471,987
Income (loss) from operations ............................... (182,971) (405,616) 125,472
Interest income ........................................... 4,749 1,680 1,222
Other income (expense), net ................................. 18,647 (2,206) 365
Income (loss) before income taxes ................................ (159,575) (406,142) 127,059
(Provision for) benefit from income taxes .......................... (49,873) 1,826 (36,464)
Net income (loss) ......................................... $ (209,448) $ (404,316) $ 90,595
Deemed dividend to a Series B-2 convertible preferred
stockholder ............................................ — — 4,590
Net income attributable to participating securities ............... — — 58,110
Net income (loss) attributable to common stockholders ........... $ (209,448) $ (404,316) $ 27,895
Net income (loss) per share attributable to common stockholders . . .
Basic ............................................... $ (0.28) $ (1.40) $ 0.12
Diluted ............................................. $ (0.28) $ (1.40) $ 0.11
Weighted average common shares used to compute net income (loss) per
share attributable to common stockholders:
Basic ................................................... 741,177 288,599 223,881
Diluted ................................................. 741,177 288,599 329,256
See accompanying notes.
69