Zynga 2012 Annual Report Download - page 56
Download and view the complete annual report
Please find page 56 of the 2012 Zynga annual report below. You can navigate through the pages in the report by either clicking on the pages listed below, or by using the keyword search tool below to find specific information within the annual report.-
 1
1 -
2
-
3
-
4
-
5
-
6
-
7
-
8
-
9
-
10
-
11
-
12
-
13
-
14
-
15
-
16
-
17
-
18
-
19
-
20
-
21
-
22
-
23
-
24
-
25
-
26
-
27
-
28
-
29
-
30
-
31
-
32
-
33
-
34
-
35
-
36
-
37
-
38
-
39
-
40
-
41
-
42
-
43
-
44
-
45
-
 46
46 -
 47
47 -
 48
48 -
 49
49 -
 50
50 -
 51
51 -
 52
52 -
 53
53 -
 54
54 -
 55
55 -
 56
56 -
 57
57 -
 58
58 -
 59
59 -
 60
60 -
 61
61 -
 62
62 -
 63
63 -
 64
64 -
 65
65 -
 66
66 -
67
-
68
-
69
-
70
-
71
-
72
-
73
-
74
-
75
-
76
-
77
-
78
-
79
-
80
-
81
-
82
-
83
-
84
-
85
-
86
-
87
-
88
-
89
-
90
-
91
-
92
-
93
-
94
-
95
-
96
-
97
-
98
-
99
-
100
-
101
-
102
-
103
-
104
-
105
-
106
-
107
-
108
-
109
-
110
-
111
-
112
-
113
-
114
-
115
-
116
-
117
-
118
-
119
-
120
-
121
-
122
 |
 |

believe continued investment in enhancing existing games and developing new games, and in software
development tools and code modification, is important to attaining our strategic objectives.
Sales and marketing. Our sales and marketing expenses consist primarily of player acquisition costs, which
are advertisements designed to drive players into our games, salaries, benefits and stock-based compensation for
our sales and marketing employees and fees paid to consultants. In addition, sales and marketing expenses
include general marketing, branding, advertising and public relations costs, as well as allocated facilities and
other supporting overhead costs. We plan to continue to invest in sales and marketing to grow our player base
and continue building brand awareness.
General and administrative. Our general and administrative expenses consist primarily of salaries, benefits
and stock-based expense for our executive, finance, legal, information technology, human resources and other
administrative employees. In addition, general and administrative expenses include outside consulting, legal and
accounting services, charitable donations and facilities and other supporting overhead costs not allocated to other
departments. General and administrative expenses also include gains and losses associated with legal settlements.
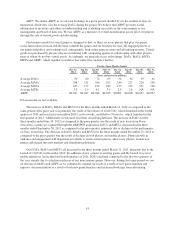
Results of Operations
The following table sets forth our results of operations for the periods presented as a percentage of revenue
for those periods:
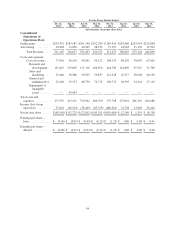
For the Year Ended December 31,
Consolidated Statements of Operations Data:2012 2011 2010
Revenue .......................................................... 100% 100% 100%
Costs and expenses:
Cost of revenue ..................................................... 27 29 29
Research and development ............................................ 50 64 25
Sales and marketing ................................................. 14 21 19
General and administrative ............................................ 15 22 6
Impairment of intangible assets ........................................ 7 — —
Total costs and expenses ............................................. 113 136 79
Income (loss) from operations ......................................... (13) (36) 21
Interest income ..................................................... — — —
Other income (expense), net ........................................... 1 — —
Income (loss) before income taxes ...................................... (12) (36) 21
(Provision for) / benefit from income taxes ............................... (4) 1 (6)
Net income (loss) ................................................... (16)% (35)% 15%
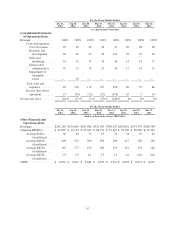
Revenue
Year Ended December 31, 2011 to 2012
% Change
2010 to 2011
% Change2012 2011 2010
(in thousands)
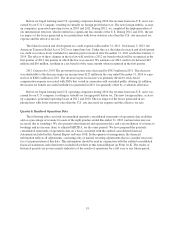
Revenue by type:
Online game ........................ $1,144,252 $1,065,648 $574,632 7% 85%
Advertising ......................... 137,015 74,452 22,827 84% 226%
Total revenue ................... $1,281,267 $1,140,100 $597,459 12% 91%
2012 Compared to 2011. Total revenue increased $141.2 million in 2012 as a result of growth in both online
game and advertising revenue. Bookings decreased by $7.9 million from 2011 to 2012. ABPU decreased from
$0.055 from 2011 to $0.050 in 2012. DAUs increased from 57 million in 2011 to 63 million in 2012.
48