Zynga 2012 Annual Report Download - page 60
Download and view the complete annual report
Please find page 60 of the 2012 Zynga annual report below. You can navigate through the pages in the report by either clicking on the pages listed below, or by using the keyword search tool below to find specific information within the annual report.-
 1
1 -
2
-
3
-
4
-
5
-
6
-
7
-
8
-
9
-
10
-
11
-
12
-
13
-
14
-
15
-
16
-
17
-
18
-
19
-
20
-
21
-
22
-
23
-
24
-
25
-
26
-
27
-
28
-
29
-
30
-
31
-
32
-
33
-
34
-
35
-
36
-
37
-
38
-
39
-
40
-
41
-
42
-
43
-
44
-
45
-
46
-
47
-
48
-
49
-
 50
50 -
 51
51 -
 52
52 -
 53
53 -
 54
54 -
 55
55 -
 56
56 -
 57
57 -
 58
58 -
 59
59 -
 60
60 -
 61
61 -
 62
62 -
 63
63 -
 64
64 -
 65
65 -
 66
66 -
 67
67 -
 68
68 -
 69
69 -
 70
70 -
71
-
72
-
73
-
74
-
75
-
76
-
77
-
78
-
79
-
80
-
81
-
82
-
83
-
84
-
85
-
86
-
87
-
88
-
89
-
90
-
91
-
92
-
93
-
94
-
95
-
96
-
97
-
98
-
99
-
100
-
101
-
102
-
103
-
104
-
105
-
106
-
107
-
108
-
109
-
110
-
111
-
112
-
113
-
114
-
115
-
116
-
117
-
118
-
119
-
120
-
121
-
122
 |
 |

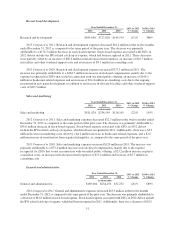
million in allocated facilities and overhead costs, offset by a $12.0 million increase in depreciation and amortization,
and a $15.6 million increase in consulting expense, as compared to the same period of the prior year.
2011 Compared to 2010. General and administrative expenses increased $222.2 million in 2011. The
increase was primarily attributable to an increase of $120.9 million in stock-based compensation, mainly due to
the expense recognized for ZSUs that vested in connection with our initial public offering, a $41.7 million
increase in headcount-related expenses, a $9.8 million increase in information technology costs and a $10.0
million increase in depreciation expense. The increase in general and administrative expenses was also due to a
$39.3 million gain from legal settlements that was recognized in 2010.
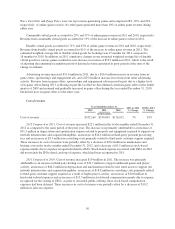
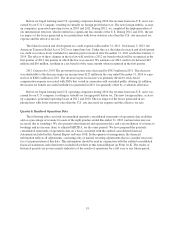
Interest income
Year Ended December 31, 2011 to 2012
% Change
2010 to 2011
% Change2012 2011 2010
(in thousands)
Interest income ................................... $4,749 $1,680 $1,222 183% 37%
2012 Compared to 2011. Interest income increased $3.1 million in the twelve months ended December 31,
2012. The increase was primarily attributable to the increase in our cash and marketable securities balance driven
by the increase in cash flows from operations and proceeds from our IPO in December 2011.
2011 Compared to 2010. Interest income increased $0.5 million in 2011. The increase was primarily
attributable to the increase in our cash and marketable securities balance driven by the increase in cash flows from
operations and proceeds from the sale and issuance of shares of our Series C preferred stock in February 2011.
Other income (expense), net
Year Ended December 31, 2011 to 2012
% Change
2010 to 2011
% Change2012 2011 2010
(in thousands)
Other income (expense), net ........................ $18,647 $(2,206) $365 NM NM
2012 Compared to 2011. Other income (expense), net increased $20.9 million in the twelve months ended
December 31,2012 as compared to the same period of the prior year. The increase was primarily attributable to
the $19.9 million net gain recognized on the termination of a lease of our headquarters building in connection
with the related purchase of that building.
2011 Compared to 2010. Other income (expense), net decreased $2.6 million in 2011. The decrease was
primarily attributable to increased interest expense under the terms of a revolving credit agreement signed in July 2011.
(Provision for) / benefit from income taxes
Year Ended December 31, 2011 to 2012
% Change
2010 to 2011
% Change2012 2011 2010
(in thousands)
(Provision for) / benefit from income taxes ......... $(49,873) $1,826 $(36,464) NM NM
2012 Compared to 2011. The provision for income taxes increased by $51.7 million in the twelve months
ended December 31, 2012 as compared to the same period of the prior year. This increase was attributable in part
to a reduction in the pre-tax worldwide loss of $246.6 million in the twelve months ended December 31, 2012, as
well as the cost of acquisitions, the cost of fully implementing our international structure, and a current year
valuation allowance offsetting a portion of our net deferred tax assets.
52