Zynga 2012 Annual Report Download - page 82
Download and view the complete annual report
Please find page 82 of the 2012 Zynga annual report below. You can navigate through the pages in the report by either clicking on the pages listed below, or by using the keyword search tool below to find specific information within the annual report.-
 1
1 -
2
-
3
-
4
-
5
-
6
-
7
-
8
-
9
-
10
-
11
-
12
-
13
-
14
-
15
-
16
-
17
-
18
-
19
-
20
-
21
-
22
-
23
-
24
-
25
-
26
-
27
-
28
-
29
-
30
-
31
-
32
-
33
-
34
-
35
-
36
-
37
-
38
-
39
-
40
-
41
-
42
-
43
-
44
-
45
-
46
-
47
-
48
-
49
-
50
-
51
-
52
-
53
-
54
-
55
-
56
-
57
-
58
-
59
-
60
-
61
-
62
-
63
-
64
-
65
-
66
-
67
-
68
-
69
-
70
-
71
-
 72
72 -
 73
73 -
 74
74 -
 75
75 -
 76
76 -
 77
77 -
 78
78 -
 79
79 -
 80
80 -
 81
81 -
 82
82 -
 83
83 -
 84
84 -
 85
85 -
 86
86 -
 87
87 -
 88
88 -
 89
89 -
 90
90 -
 91
91 -
 92
92 -
93
-
94
-
95
-
96
-
97
-
98
-
99
-
100
-
101
-
102
-
103
-
104
-
105
-
106
-
107
-
108
-
109
-
110
-
111
-
112
-
113
-
114
-
115
-
116
-
117
-
118
-
119
-
120
-
121
-
122
 |
 |

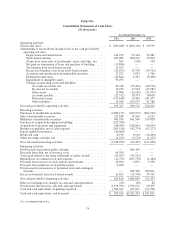
Zynga Inc.
Consolidated Statements of Cash Flows
(In thousands)
Year Ended December 31,
2012 2011 2010
Operating activities
Net income (loss) ............................................ $ (209,448) $ (404,316) $ 90,595
Adjustments to reconcile net income (loss) to net cash provided by
operating activities:
Depreciation and amortization ............................. 141,479 95,414 39,481
Stock-based expense ..................................... 281,986 600,212 25,694
(Gain) Loss from sales of investments, assets and other, net ...... 563 (550) 558
Net gain on termination of lease and purchase of building ........ (19,886) — —
Tax benefits from stock-based awards ....................... 21,652 — —
Excess tax (benefits) costs from stock-based awards ............ (21,652) 13,750 (39,742)
Accretion and amortization on marketable securities ............ 17,223 2,873 1,746
Deferred income taxes .................................... (43,841) 4,367 (8,469)
Impairment of intangible assets ............................. 95,493 — —
Changes in operating assets and liabilities:
Accounts receivable, net .............................. 34,338 (55,432) (69,518)
Income tax receivable ................................ 12,976 17,994 (25,287)
Other assets ........................................ 19,908 (14,559) (32,495)
Accounts payable .................................... (21,312) 10,373 10,626
Deferred revenue .................................... (133,640) 15,409 241,437
Other liabilities ..................................... 19,928 103,637 91,786
Net cash provided by operating activities ......................... 195,767 389,172 326,412
Investing activities
Purchases of marketable securities .............................. (1,826,137) (649,972) (804,542)
Sales of marketable securities .................................. 223,828 19,206 4,222
Maturities of marketable securities .............................. 647,916 841,560 319,820
Purchase of corporate headquarters building ...................... (233,700) — —
Acquisition of property and equipment ........................... (98,054) (238,091) (56,839)
Business acquisition, net of cash acquired ........................ (205,510) (42,774) (62,277)
Equity method investment ..................................... (10,000) — —
Restricted cash .............................................. 6,979 9,194 (16,469)
Other investing activities, net .................................. (2,256) (2,578) (1,353)
Net cash used in investing activities ............................. (1,496,934) (63,455) (617,438)
Financing activities
Net Proceeds from initial public offering ......................... — 961,403 —
Proceeds from debt, net of issuance costs ......................... 99,780 — —
Taxes paid related to net share settlement of equity awards ........... (26,307) (83,232) —
Repurchases of common stock and warrants ....................... (11,756) (283,770) (1,484)
Proceeds from exercise of stock options and warrants ............... 16,960 2,893 3,358
Proceeds from employee stock purchase plan ...................... 4,489 — —
Net proceeds from issuance of preferred stock and contingent
warrants ................................................. — 485,300 309,821
Excess tax benefits from stock-based awards ...................... 21,652 (13,750) 39,742
Net cash provided by financing activities ......................... 104,818 1,068,844 351,437
Effect of exchange rate changes on cash and cash equivalents ......... (45) (49) 84
Net increase (decrease) in cash and cash equivalents ................ (1,196,394) 1,394,512 60,495
Cash and cash equivalents, beginning of period .................... 1,582,343 187,831 127,336
Cash and cash equivalents, end of period ......................... $ 385,949 $1,582,343 $ 187,831
See accompanying notes.
74