Zynga 2012 Annual Report Download - page 102
Download and view the complete annual report
Please find page 102 of the 2012 Zynga annual report below. You can navigate through the pages in the report by either clicking on the pages listed below, or by using the keyword search tool below to find specific information within the annual report.-
 1
1 -
2
-
3
-
4
-
5
-
6
-
7
-
8
-
9
-
10
-
11
-
12
-
13
-
14
-
15
-
16
-
17
-
18
-
19
-
20
-
21
-
22
-
23
-
24
-
25
-
26
-
27
-
28
-
29
-
30
-
31
-
32
-
33
-
34
-
35
-
36
-
37
-
38
-
39
-
40
-
41
-
42
-
43
-
44
-
45
-
46
-
47
-
48
-
49
-
50
-
51
-
52
-
53
-
54
-
55
-
56
-
57
-
58
-
59
-
60
-
61
-
62
-
63
-
64
-
65
-
66
-
67
-
68
-
69
-
70
-
71
-
72
-
73
-
74
-
75
-
76
-
77
-
78
-
79
-
80
-
81
-
82
-
83
-
84
-
85
-
86
-
87
-
88
-
89
-
90
-
91
-
 92
92 -
 93
93 -
 94
94 -
 95
95 -
 96
96 -
 97
97 -
 98
98 -
 99
99 -
 100
100 -
 101
101 -
 102
102 -
 103
103 -
 104
104 -
 105
105 -
 106
106 -
 107
107 -
 108
108 -
 109
109 -
 110
110 -
 111
111 -
 112
112 -
113
-
114
-
115
-
116
-
117
-
118
-
119
-
120
-
121
-
122
 |
 |

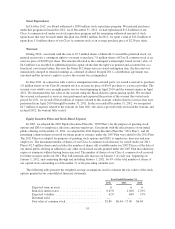
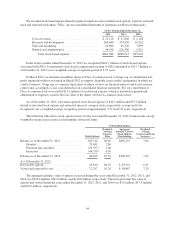
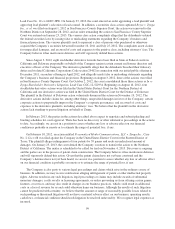
We recorded stock-based expense related to grants of employee and consultant stock options, warrants, restricted
stock and restricted stock units (“ZSUs”) in our consolidated statements of operations as follows (in thousands):
Twelve Months Ended December 31,
2012 2011 2010
Cost of revenue ................................ $ 12,116 $ 17,660 $ 2,128
Research and development ....................... 200,640 374,920 10,242
Sales and marketing ............................ 24,684 81,326 7,899
General and administrative ...................... 44,546 126,306 5,425
Total stock-based expense ................... $281,986 $600,212 $25,694
In the twelve months ended December 31, 2012 we recognized $204.7 million of stock-based expense
associated with ZSUs. Unamortized stock-based compensation relating to ZSUs amounted to $312.7 million as
of December 31, 2012 over a weighted-average recognition period of 2.72 years.
In March 2012, we donated one million shares of Class A common stock to Zynga.org, an unaffiliated non-
profit organization that was formed in March 2012 to support charitable causes in the communities in which we
conduct business. Zynga.org is a separate legal entity in which we have no financial interest and do not exercise
control and, accordingly, is not consolidated in our consolidated financial statements. For our contribution of
Class A common stock we recorded $13.1 million of stock-based expense, which is included in general and
administrative expenses, equal to the fair value of the shares of Class A common stock issued.
As of December 31, 2012, total unrecognized stock-based expense of $44.3 million and $35.3 million
related to unvested stock options and restricted shares of common stock, respectively, is expected to be
recognized over a weighted-average recognition period of approximately 3.27 and 2.74 years, respectively.
The following table shows stock option activity for the year ended December 31, 2012 (in thousands, except
weighted-average exercise price and remaining contractual term):
Outstanding Options
Stock Options
Weighted-
Average
Exercise
Price
Aggregate
Intrinsic Value of
Stock Options
Outstanding
Weighted-
Average
Contractual Term
(in years)
Balance as of December 31, 2011 .............. 102,314 $0.69 $892,135 7.04
Granted ............................... 29,401 2.80
Forfeited and cancelled ................... (10,337) 1.48
Exercised .............................. (40,559) 0.36
Balance as of December 31, 2012 .............. 80,819 $1.52 $100,225 7.43
As of December 31, 2012
Exercisable options .......................... 43,810 $0.53 $ 85,591 6.31
Vested and expected to vest ................... 72,297 $1.20 $ 98,867 7.29
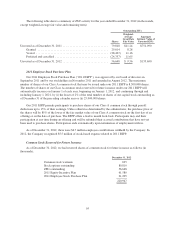
The aggregate intrinsic value of options exercised during the years ended December 31, 2012, 2011, and
2010 was $222.4 million, $78.2 million, and $110.6 million, respectively. The total grant date fair value of
options that vested during the years ended December 31, 2012, 2011, and 2010 was $7.6 million, $17.5 million
and $12.9 million, respectively.
94