Zynga 2012 Annual Report Download - page 76
Download and view the complete annual report
Please find page 76 of the 2012 Zynga annual report below. You can navigate through the pages in the report by either clicking on the pages listed below, or by using the keyword search tool below to find specific information within the annual report.-
 1
1 -
2
-
3
-
4
-
5
-
6
-
7
-
8
-
9
-
10
-
11
-
12
-
13
-
14
-
15
-
16
-
17
-
18
-
19
-
20
-
21
-
22
-
23
-
24
-
25
-
26
-
27
-
28
-
29
-
30
-
31
-
32
-
33
-
34
-
35
-
36
-
37
-
38
-
39
-
40
-
41
-
42
-
43
-
44
-
45
-
46
-
47
-
48
-
49
-
50
-
51
-
52
-
53
-
54
-
55
-
56
-
57
-
58
-
59
-
60
-
61
-
62
-
63
-
64
-
65
-
 66
66 -
 67
67 -
 68
68 -
 69
69 -
 70
70 -
 71
71 -
 72
72 -
 73
73 -
 74
74 -
 75
75 -
 76
76 -
 77
77 -
 78
78 -
 79
79 -
 80
80 -
 81
81 -
 82
82 -
 83
83 -
 84
84 -
 85
85 -
 86
86 -
87
-
88
-
89
-
90
-
91
-
92
-
93
-
94
-
95
-
96
-
97
-
98
-
99
-
100
-
101
-
102
-
103
-
104
-
105
-
106
-
107
-
108
-
109
-
110
-
111
-
112
-
113
-
114
-
115
-
116
-
117
-
118
-
119
-
120
-
121
-
122
 |
 |

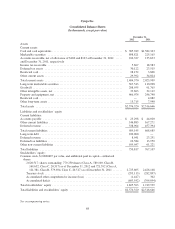
Zynga Inc.
Consolidated Balance Sheets
(In thousands, except par value)
December 31,
2012 2011
Assets
Current assets:
Cash and cash equivalents ................................................ $ 385,949 $1,582,343
Marketable securities ................................................... 898,821 225,165
Accounts receivable, net of allowance of $160 and $163 at December 31, 2012 ..... 106,327 135,633
and December 31, 2011, respectively
Income tax receivable ................................................... 5,607 18,583
Deferred tax assets ..................................................... 30,122 23,515
Restricted cash ......................................................... 28,152 3,846
Other current assets ..................................................... 29,392 34,824
Total current assets ..................................................... 1,484,370 2,023,909
Long-term marketable securities ........................................... 367,543 110,098
Goodwill ............................................................. 208,955 91,765
Other intangible assets, net ............................................... 33,663 32,112
Property and equipment, net .............................................. 466,074 246,740
Restricted cash ......................................................... — 4,082
Other long-term assets ................................................... 15,715 7,940
Total assets ........................................................... $2,576,320 $2,516,646
Liabilities and stockholders’ equity
Current liabilities:
Accounts payable ...................................................... $ 23,298 $ 44,020
Other current liabilities .................................................. 146,883 167,271
Deferred revenue ....................................................... 338,964 457,394
Total current liabilities .................................................. 509,145 668,685
Long-term debt ........................................................ 100,000 —
Deferred revenue ....................................................... 8,041 23,251
Deferred tax liabilities ................................................... 24,584 13,950
Other non-current liabilities .............................................. 109,047 61,221
Total liabilities ........................................................ 750,817 767,107
Stockholders’ equity:
Common stock, $.00000625 par value, and additional paid in capital—authorized
shares:
2,020,517; shares outstanding: 779,250 shares (Class A, 589,100, Class B,
169,632, Class C, 20,517) as of December 31, 2012 and 721,592 (Class A,
121,381, Class B, 579,694, Class C, 20,517) as of December 31, 2011 ....... 2,725,605 2,426,168
Treasury stock ..................................................... (295,113) (282,897)
Accumulated other comprehensive income (loss) ......................... (1,447) 362
Accumulated deficit ................................................ (603,542) (394,094)
Total stockholders’ equity ................................................ 1,825,503 1,749,539
Total liabilities and stockholders’ equity .................................... $2,576,320 $2,516,646
See accompanying notes.
68