Zynga 2012 Annual Report Download - page 57
Download and view the complete annual report
Please find page 57 of the 2012 Zynga annual report below. You can navigate through the pages in the report by either clicking on the pages listed below, or by using the keyword search tool below to find specific information within the annual report.-
 1
1 -
2
-
3
-
4
-
5
-
6
-
7
-
8
-
9
-
10
-
11
-
12
-
13
-
14
-
15
-
16
-
17
-
18
-
19
-
20
-
21
-
22
-
23
-
24
-
25
-
26
-
27
-
28
-
29
-
30
-
31
-
32
-
33
-
34
-
35
-
36
-
37
-
38
-
39
-
40
-
41
-
42
-
43
-
44
-
45
-
46
-
 47
47 -
 48
48 -
 49
49 -
 50
50 -
 51
51 -
 52
52 -
 53
53 -
 54
54 -
 55
55 -
 56
56 -
 57
57 -
 58
58 -
 59
59 -
 60
60 -
 61
61 -
 62
62 -
 63
63 -
 64
64 -
 65
65 -
 66
66 -
 67
67 -
68
-
69
-
70
-
71
-
72
-
73
-
74
-
75
-
76
-
77
-
78
-
79
-
80
-
81
-
82
-
83
-
84
-
85
-
86
-
87
-
88
-
89
-
90
-
91
-
92
-
93
-
94
-
95
-
96
-
97
-
98
-
99
-
100
-
101
-
102
-
103
-
104
-
105
-
106
-
107
-
108
-
109
-
110
-
111
-
112
-
113
-
114
-
115
-
116
-
117
-
118
-
119
-
120
-
121
-
122
 |
 |
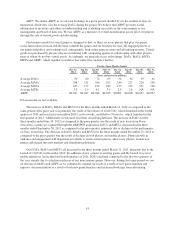
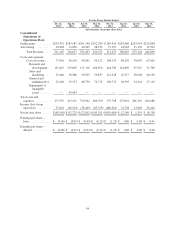
Online game revenue increased $78.6 million in 2012 as compared to the same period of the prior year. This
increase is primarily attributable to increases in revenue from CastleVille, Zynga Poker, Hidden Chronicles and
FarmVille 2 in the amounts of $98.3 million, $55.2 million, $29.6 million, and $12.1 million, respectively. The
increases in online game revenue from CastleVille, Hidden Chronicles and Farmville 2 were the result of these games’
more recent launch dates in November 2011, February 2012, and September 2012, respectively. The increase in online
game revenue from Zynga Poker was mainly due to bookings growth on mobile platforms. The growth in online game
revenue was partially offset by decreases in online game revenue of $90.9 million and $77.4 million from Mafia Wars
and FrontierVille, respectively which was primarily due to an overall decrease in bookings driven by a shift in players
to newer games. In addition, $18.2 million of the decrease in online game revenue from FrontierVille was due to
changes in our estimated average life of durable virtual goods during 2011 which resulted in higher revenue in 2011.
All other games accounted for the remaining net increase of $51.7 million.
International revenue as a percentage of total revenue was 41% and 36% in 2012 and 2011, respectively.
In 2012, FarmVille,Zynga Poker, and CityVille, were our top revenue-generating games and comprised
24%, 19%, and 12%, respectively, of our online game revenue for the period. No other game generated more
than 10% of online game revenue during the year.
Consumable virtual goods accounted for 30% and 29% of online game revenue 2012 and 2011, respectively.
Durable virtual goods accounted for 70% and 71% of online game revenue in 2012 and 2011, respectively. The
estimated weighted-average life of durable virtual goods was 12 months in 2012, compared to 15 months in
2011. In addition, changes in our estimated average life of durable virtual goods during 2012 for various games
resulted in an increase in revenue of $14.1 million in that period, which is the result of adjusting the remaining
recognition period of deferred revenue generated in prior periods at the time of a change in estimate. For 2011,
changes in our estimated average life of durable virtual goods resulted in an increase in revenue of $53.9 million.
Advertising revenue increased $62.6 million from 2011 to 2012, due to a $62.3 million increase in in-game
display ads, a $7.9 million increase in licensing revenue, and a $9.0 million increase in in-game sponsorship
revenue, offset by a decrease of $16.6 million from in-game offers, engagement ads and other advertising revenue.
2011 Compared to 2010. Total revenue increased $542.6 million in 2011, as a result of growth in both
online game and advertising revenue. Bookings increased by $316.6 million from 2010 to 2011. ABPU increased
from $0.041 to $0.055, reflecting improved overall monetization of our players, while DAUs increased from
56 million to 57 million. Despite the increase in revenue the adoption of Facebook Credits as our primary in-
game payment method beginning in the third quarter of 2010 negatively impacted online game revenue in 2011
due to the fact that we record revenue net of amounts retained by Facebook.
Online game revenue increased $491.0 million in 2011. FarmVille, FrontierVille and CityVille accounted
for $118.7 million, $137.4 million and $139.1 million of the increase, respectively. FarmVille was launched in
June 2009, and the increase in revenue reflects an increase in bookings from new content, as well as the
recognition of revenue derived from deferred revenue built up over a longer period of time. The increase in
revenue from FrontierVille and CityVille was the result of the launch of these games in June 2010 and December
2010, respectively, and, with respect to FrontierVille, a change in the estimated weighted-average life used to
recognize revenue from durable virtual goods, which resulted in a $18.2 million increase in revenue from
FrontierVille in 2011. All other games accounted for the remaining net increase of $95.8 million.
International revenue as a percentage of total revenue accounted for 36% and 33% in 2011 and 2010,
respectively.
In 2011, FarmVille,FrontierVille,Zynga Poker,Mafia Wars and CityVille were our top revenue-generating
games and comprised 27%, 15%, 15%, 13% and 13%, respectively, of our online game revenue. In 2010, Mafia
49