Zynga 2012 Annual Report Download - page 49
Download and view the complete annual report
Please find page 49 of the 2012 Zynga annual report below. You can navigate through the pages in the report by either clicking on the pages listed below, or by using the keyword search tool below to find specific information within the annual report.-
 1
1 -
2
-
3
-
4
-
5
-
6
-
7
-
8
-
9
-
10
-
11
-
12
-
13
-
14
-
15
-
16
-
17
-
18
-
19
-
20
-
21
-
22
-
23
-
24
-
25
-
26
-
27
-
28
-
29
-
30
-
31
-
32
-
33
-
34
-
35
-
36
-
37
-
38
-
 39
39 -
 40
40 -
 41
41 -
 42
42 -
 43
43 -
 44
44 -
 45
45 -
 46
46 -
 47
47 -
 48
48 -
 49
49 -
 50
50 -
 51
51 -
 52
52 -
 53
53 -
 54
54 -
 55
55 -
 56
56 -
 57
57 -
 58
58 -
 59
59 -
60
-
61
-
62
-
63
-
64
-
65
-
66
-
67
-
68
-
69
-
70
-
71
-
72
-
73
-
74
-
75
-
76
-
77
-
78
-
79
-
80
-
81
-
82
-
83
-
84
-
85
-
86
-
87
-
88
-
89
-
90
-
91
-
92
-
93
-
94
-
95
-
96
-
97
-
98
-
99
-
100
-
101
-
102
-
103
-
104
-
105
-
106
-
107
-
108
-
109
-
110
-
111
-
112
-
113
-
114
-
115
-
116
-
117
-
118
-
119
-
120
-
121
-
122
 |
 |
willing to pay for other forms of entertainment. They enjoy the additional playing time or added convenience, the
ability to personalize their own game boards, the satisfaction of leveling up and the opportunity for sharing
creative expressions. We believe players are more likely to purchase virtual goods when they are connected to
and playing with their friends, whether those friends play for free or also purchase virtual goods. Players may
also elect to pay a one-time download fee to obtain an ad-free mobile game.
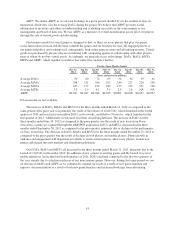
Facebook is currently the primary distribution, marketing, promotion and payment platform for our games.
We generate a significant portion of our revenue through the Facebook platform and expect to continue to do so
for the foreseeable future. For example, for the twelve months ended December 31, 2012 and 2011, we estimate
that 81% and 93% of our bookings, respectively, was generated through the Facebook platform, while 18% and
5% of our bookings, respectively, were generated through mobile platforms. For the twelve months ended
December 31, 2012 and 2011, we estimate that 86% and 93% of our revenue, respectively, were generated
through the Facebook platform, while 13% and 4% of our revenue, respectively, were generated through mobile
platforms. We have had to estimate this information because certain payment methods we accept and advertising
networks do not allow us to determine the platform used.
We began migrating to Facebook Credits in July 2010 pursuant to an addendum to Facebook’s standard
terms and conditions, and in April 2011, we completed this migration. Contractually, Facebook remits to us an
amount equal to 70% of the price stated to our players for use in our games. We recognize revenue net of
amounts retained by Facebook. Prior to our migration to Facebook Credits, we used third-party payment
processors and paid these processors service fees ranging from 2% to 10% of the purchase price of our virtual
goods which were recorded in cost of revenue. Players can purchase Facebook Credits from Facebook directly
through our games or through game cards purchased from retailers and distributors.
In June 2012, Facebook announced its plans to discontinue the use of Facebook Credits and instead support
pricing in local currencies. We expect to begin our transition away from Facebook Credits and to adopt
Facebook’s local currency-based payments model in the first half of 2013.
On platforms other than Facebook, players purchase our virtual goods through various widely accepted
payment methods offered in the games, including credit cards, PayPal, Apple iTunes accounts and direct wires.
Players can purchase game cards from retailers and distributors that can be redeemed in our games.
Advertising. Advertising revenue primarily includes branded virtual goods and sponsorships, engagement
ads and offers, mobile ads, display ads and licensing. We generally report our advertising revenue net of amounts
due to advertising agencies and brokers.
Key Metrics
We regularly review a number of metrics, including the following key financial and operating metrics, to
evaluate our business, measure our performance, identify trends in our business, prepare financial projections and
make strategic decisions.
Key Financial Metrics
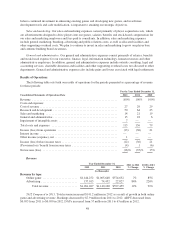
Bookings. Bookings is a non-GAAP financial measure that is equal to revenue recognized during the period
plus the change in deferred revenue during the period. We record the sale of virtual goods and mobile downloads
as deferred revenue and then recognize that revenue over the estimated average payer life or as the virtual goods
are consumed. Advertising sales which consist of certain branded virtual goods and sponsorships are also
deferred and recognized over the estimated average life of the branded virtual good, similar to online game
revenue. Bookings, as opposed to revenue, is the fundamental top-line metric we use to manage our business, as
we believe it is a better indicator of the sales activity in a given period. Over the long term, the factors impacting
our bookings and revenue are the same. However, in the short term, there are factors that may cause revenue to
exceed or be less than bookings in any period.
41