Western Union 2014 Annual Report Download - page 76
Download and view the complete annual report
Please find page 76 of the 2014 Western Union annual report below. You can navigate through the pages in the report by either clicking on the pages listed below, or by using the keyword search tool below to find specific information within the annual report.-
 1
1 -
 2
2 -
 3
3 -
 4
4 -
 5
5 -
 6
6 -
 7
7 -
 8
8 -
 9
9 -
 10
10 -
 11
11 -
 12
12 -
 13
13 -
 14
14 -
 15
15 -
 16
16 -
 17
17 -
 18
18 -
 19
19 -
 20
20 -
 21
21 -
 22
22 -
 23
23 -
 24
24 -
 25
25 -
 26
26 -
 27
27 -
 28
28 -
 29
29 -
 30
30 -
 31
31 -
 32
32 -
 33
33 -
 34
34 -
 35
35 -
 36
36 -
 37
37 -
 38
38 -
 39
39 -
 40
40 -
 41
41 -
 42
42 -
 43
43 -
 44
44 -
 45
45 -
 46
46 -
 47
47 -
 48
48 -
 49
49 -
 50
50 -
 51
51 -
 52
52 -
 53
53 -
 54
54 -
 55
55 -
 56
56 -
 57
57 -
 58
58 -
 59
59 -
 60
60 -
 61
61 -
 62
62 -
 63
63 -
 64
64 -
 65
65 -
 66
66 -
 67
67 -
 68
68 -
 69
69 -
 70
70 -
 71
71 -
 72
72 -
 73
73 -
 74
74 -
 75
75 -
 76
76 -
 77
77 -
 78
78 -
 79
79 -
 80
80 -
 81
81 -
 82
82 -
 83
83 -
 84
84 -
 85
85 -
 86
86 -
 87
87 -
 88
88 -
 89
89 -
 90
90 -
 91
91 -
 92
92 -
 93
93 -
 94
94 -
 95
95 -
 96
96 -
 97
97 -
 98
98 -
 99
99 -
 100
100 -
 101
101 -
 102
102 -
 103
103 -
 104
104 -
 105
105 -
 106
106 -
 107
107 -
 108
108 -
 109
109 -
 110
110 -
 111
111 -
 112
112 -
 113
113 -
 114
114 -
 115
115 -
 116
116 -
 117
117 -
 118
118 -
 119
119 -
 120
120 -
 121
121 -
 122
122 -
 123
123 -
 124
124 -
 125
125 -
 126
126 -
 127
127 -
 128
128 -
 129
129 -
 130
130 -
 131
131 -
 132
132 -
 133
133 -
 134
134 -
 135
135 -
 136
136 -
 137
137 -
 138
138 -
 139
139 -
 140
140 -
 141
141 -
 142
142 -
 143
143 -
 144
144 -
 145
145 -
 146
146 -
 147
147 -
 148
148 -
 149
149 -
 150
150 -
 151
151 -
 152
152 -
 153
153 -
 154
154 -
 155
155 -
 156
156 -
 157
157 -
 158
158 -
 159
159 -
 160
160 -
 161
161 -
 162
162 -
 163
163 -
 164
164 -
 165
165 -
 166
166 -
 167
167 -
 168
168 -
 169
169 -
 170
170 -
 171
171 -
 172
172 -
 173
173 -
 174
174 -
 175
175 -
 176
176 -
 177
177 -
 178
178 -
 179
179 -
 180
180 -
 181
181 -
 182
182 -
 183
183 -
 184
184 -
 185
185 -
 186
186 -
 187
187 -
 188
188 -
 189
189 -
 190
190 -
 191
191 -
 192
192 -
 193
193 -
 194
194 -
 195
195 -
 196
196 -
 197
197 -
 198
198 -
 199
199 -
 200
200 -
 201
201 -
 202
202 -
 203
203 -
 204
204 -
 205
205 -
 206
206 -
 207
207 -
 208
208 -
 209
209 -
 210
210 -
 211
211 -
 212
212 -
 213
213 -
 214
214 -
 215
215 -
 216
216 -
 217
217 -
 218
218 -
 219
219 -
 220
220 -
 221
221 -
 222
222 -
 223
223 -
 224
224 -
 225
225 -
 226
226 -
 227
227 -
 228
228 -
 229
229 -
 230
230 -
 231
231 -
 232
232 -
 233
233 -
 234
234 -
 235
235 -
 236
236 -
 237
237 -
 238
238 -
 239
239 -
 240
240 -
 241
241 -
 242
242 -
 243
243 -
 244
244 -
 245
245 -
 246
246 -
 247
247 -
 248
248 -
 249
249 -
 250
250 -
 251
251 -
 252
252 -
 253
253 -
 254
254 -
 255
255 -
 256
256 -
 257
257 -
 258
258 -
 259
259 -
 260
260 -
 261
261 -
 262
262 -
 263
263 -
 264
264 -
 265
265 -
 266
266 -
 267
267 -
 268
268 -
 269
269 -
 270
270 -
 271
271 -
 272
272 -
 273
273 -
 274
274 -
 275
275 -
 276
276 -
 277
277 -
 278
278 -
 279
279 -
 280
280 -
 281
281 -
 282
282 -
 283
283 -
 284
284 -
 285
285 -
 286
286 -
 287
287 -
 288
288 -
 289
289 -
 290
290 -
 291
291 -
 292
292 -
 293
293 -
 294
294 -
 295
295 -
 296
296 -
 297
297 -
 298
298 -
 299
299 -
 300
300 -
 301
301 -
 302
302 -
 303
303 -
 304
304 -
 305
305 -
 306
306
 |
 |

Executive Compensation PROXY STATEMENT
The Western Union Company – Proxy Statement | 58
NOTICE OF 2015 ANNUAL MEETING OF STOCKHOLDERS AND PROXY STATEMENT
Executive Compensation
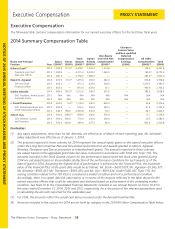
The following table contains compensation information for our named executive officers for the last three fiscal years.
2014 Summary Compensation Table
Name and Principal
Position Year
Salary
($000)(1)
Bonus
($000)
Stock
Awards
($000)(2)
Option
Awards
($000)(2)
Non-Equity
Incentive Plan
Compensation
($000)(3)
Change in
Pension Value
and Non-qualified
Deferred
Compensation
Earnings
($000)
All Other
Compensation
($000)(4)
Total
($000)
Hikmet Ersek(5) 2014 1,000.0 115.0(6) 4,478.1 1,200.0 1,314.8 — 133.9 8,241.8
President and Chief
Executive Officer
2013 1,000.0 — 4,375.0 2,000.0 1,260.0 — 140.9(7) 8,775.9
2012 987.5 — 3,758.9 1,980.0 — — 282.6(7) 7,009.0
Rajesh K. Agrawal 2014 472.0 93.4(8) 1,435.6 260.0 442.4 — 674.8 3,378.2
EVP and Chief
Financial Officer
2013 405.0 — 972.3 429.0 324.0 — 1,230.2 3,360.5
2012 405.0 — 814.4 429.0 97.2 — 960.6 2,706.2
Odilon Almeida 2014 600.0 193.2(9) 1,312.6 240.0 507.6 — 185.5 3,038.9
EVP, President, Americas and
European Union
2013 N/A N/A N/A N/A N/A N/A N/A N/A
2012 N/A N/A N/A N/A N/A N/A N/A N/A
J. David Thompson 2014 500.0 9.0(10)1,118.0 240.0 459.0 — 50.4 2,376.4
EVP, Global Operations and
Chief Information Officer
2013 500.0 — 916.5 396.0 360.0 — 61.4 2,233.9
2012 344.7 158.6 2,453.8 330.0 74.7 — 64.7 3,426.5
John R. Dye 2014 500.0 208.0(11)838.9 200.0 376.0 — 11.7 2,134.6
EVP, General Counsel
and Secretary
2013 500.0 300.0 770.0 330.0 360.0 — 20.5 2,280.5
2012 500.0 404.0 469.9 247.5 96.0 — 603.4 2,320.8
Footnotes:
(1) Any salary adjustments, other than for Mr. Almeida, are effective as of March of each reporting year. Mr. Almeida’s
salary adjustment was effective as of January 1, 2014.
(2) The amounts reported in these columns for 2014 represent the annual equity grants to the named executive officers
under the Long-Term Incentive Plan and time-based restricted stock unit awards granted to Messrs. Agrawal,
Almeida, Thompson and Dye as promotion or retention/merit grants. The amounts reported in these columns
are valued based on the aggregate grant date fair value computed in accordance with FASB ASC Topic 718. The
amounts included in the Stock Awards column for the performance-based restricted stock units granted during
2014 are calculated based on the probable satisfaction of the performance conditions for such awards as of the
date of grant in 2014. Assuming the highest level of performance is achieved for the Financial PSUs, the maximum
value of the Financial PSUs at the grant date would be as follows: Mr. Ersek—$4,917,079; Mr. Agrawal—$1,065,377;
Mr. Almeida—$983,433; Mr. Thompson—$983,433; and Mr. Dye—$819,524. Under FASB ASC Topic 718, the
vesting condition related to the TSR PSUs is considered a market condition and not a performance condition.
Accordingly, there is no grant date fair value below or in excess of the amount reflected in the table above for the
named executive officers that could be calculated and disclosed based on achievement of the underlying market
condition. See Note 16 to the Consolidated Financial Statements included in our Annual Reports on Form 10-K for
the years ended December 31, 2014, 2013 and 2012, respectively, for a discussion of the relevant assumptions used
in calculating the amounts reported for the applicable year.
(3) For 2014, the amounts reflect the actual cash bonus received under the Annual Incentive Plan.
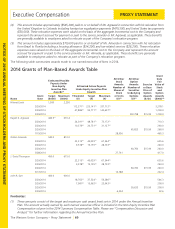
(4) Amounts included in this column for 2014 are set forth by category in the 2014 All Other Compensation Table below.
