Western Union 2014 Annual Report Download - page 202
Download and view the complete annual report
Please find page 202 of the 2014 Western Union annual report below. You can navigate through the pages in the report by either clicking on the pages listed below, or by using the keyword search tool below to find specific information within the annual report.-
 1
1 -
2
-
3
-
4
-
5
-
6
-
7
-
8
-
9
-
10
-
11
-
12
-
13
-
14
-
15
-
16
-
17
-
18
-
19
-
20
-
21
-
22
-
23
-
24
-
25
-
26
-
27
-
28
-
29
-
30
-
31
-
32
-
33
-
34
-
35
-
36
-
37
-
38
-
39
-
40
-
41
-
42
-
43
-
44
-
45
-
46
-
47
-
48
-
49
-
50
-
51
-
52
-
53
-
54
-
55
-
56
-
57
-
58
-
59
-
60
-
61
-
62
-
63
-
64
-
65
-
66
-
67
-
68
-
69
-
70
-
71
-
72
-
73
-
74
-
75
-
76
-
77
-
78
-
79
-
80
-
81
-
82
-
83
-
84
-
85
-
86
-
87
-
88
-
89
-
90
-
91
-
92
-
93
-
94
-
95
-
96
-
97
-
98
-
99
-
100
-
101
-
102
-
103
-
104
-
105
-
106
-
107
-
108
-
109
-
110
-
111
-
112
-
113
-
114
-
115
-
116
-
117
-
118
-
119
-
120
-
121
-
122
-
123
-
124
-
125
-
126
-
127
-
128
-
129
-
130
-
131
-
132
-
133
-
134
-
135
-
136
-
137
-
138
-
139
-
140
-
141
-
142
-
143
-
144
-
145
-
146
-
147
-
148
-
149
-
150
-
151
-
152
-
153
-
154
-
155
-
156
-
157
-
158
-
159
-
160
-
161
-
162
-
163
-
164
-
165
-
166
-
167
-
168
-
169
-
170
-
171
-
172
-
173
-
174
-
175
-
176
-
177
-
178
-
179
-
180
-
181
-
182
-
183
-
184
-
185
-
186
-
187
-
188
-
189
-
190
-
191
-
 192
192 -
 193
193 -
 194
194 -
 195
195 -
 196
196 -
 197
197 -
 198
198 -
 199
199 -
 200
200 -
 201
201 -
 202
202 -
 203
203 -
 204
204 -
 205
205 -
 206
206 -
 207
207 -
 208
208 -
 209
209 -
 210
210 -
 211
211 -
 212
212 -
213
-
214
-
215
-
216
-
217
-
218
-
219
-
220
-
221
-
222
-
223
-
224
-
225
-
226
-
227
-
228
-
229
-
230
-
231
-
232
-
233
-
234
-
235
-
236
-
237
-
238
-
239
-
240
-
241
-
242
-
243
-
244
-
245
-
246
-
247
-
248
-
249
-
250
-
251
-
252
-
253
-
254
-
255
-
256
-
257
-
258
-
259
-
260
-
261
-
262
-
263
-
264
-
265
-
266
-
267
-
268
-
269
-
270
-
271
-
272
-
273
-
274
-
275
-
276
-
277
-
278
-
279
-
280
-
281
-
282
-
283
-
284
-
285
-
286
-
287
-
288
-
289
-
290
-
291
-
292
-
293
-
294
-
295
-
296
-
297
-
298
-
299
-
300
-
301
-
302
-
303
-
304
-
305
-
306
 |
 |

2014 FORM 10-K
64
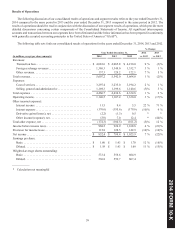
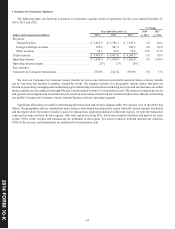
Consumer-to-Consumer Segment
The following table sets forth our Consumer-to-Consumer segment results of operations for the years ended December 31,
2014, 2013 and 2012.
% Change
Year Ended December 31, 2014 2013
(dollars and transactions in millions) 2014 2013 2012 vs. 2013 vs. 2012
Revenues:
Transaction fees . . . . . . . . . . . . . . . . . . . . . . . . . . . . . . . . . . . . $ 3,421.8 $ 3,396.1 $ 3,545.6 1% (4)%
Foreign exchange revenues . . . . . . . . . . . . . . . . . . . . . . . . . . . 998.9 981.3 988.5 2% (1)%
Other revenues . . . . . . . . . . . . . . . . . . . . . . . . . . . . . . . . . . . . . 65.1 56.2 50.2 16% 12 %
Total revenues . . . . . . . . . . . . . . . . . . . . . . . . . . . . . . . . . . . . . . . . $ 4,485.8 $ 4,433.6 $ 4,584.3 1% (3)%
Operating income . . . . . . . . . . . . . . . . . . . . . . . . . . . . . . . . . . . . . $ 1,050.4 $ 1,030.4 $ 1,266.9 2% (19)%
Operating income margin . . . . . . . . . . . . . . . . . . . . . . . . . . . . . . . 23% 23% 28%
Key indicator:
Consumer-to-Consumer transactions . . . . . . . . . . . . . . . . . . . . . . 254.93 242.34 230.98 5% 5 %
We view our Consumer-to-Consumer money transfer service as one interconnected global network where a money transfer
can be sent from one location to another, around the world. The segment includes five geographic regions whose functions are
limited to generating, managing and maintaining agent relationships and localized marketing activities and also includes our online
money transfer service conducted through Western Union branded websites ("westernunion.com"). By means of common processes
and systems, these regions and westernunion.com create an interconnected network for consumer transactions, thereby constituting
one global Consumer-to-Consumer money transfer business and one operating segment.
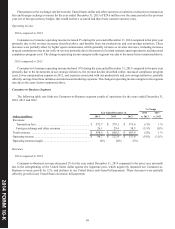
Significant allocations are made in determining the transaction and revenue changes under the regional view in the tables that
follow. The geographic split for transactions and revenue is determined based upon the region where the money transfer is initiated
and the region where the money transfer is paid. For transactions originated and paid in different regions, we split the transaction
count and revenue between the two regions, with each region receiving 50%. For money transfers initiated and paid in the same
region, 100% of the revenue and transactions are attributed to that region. For money transfers initiated through our websites,
100% of the revenue and transactions are attributed to westernunion.com.