Western Union 2014 Annual Report Download - page 281
Download and view the complete annual report
Please find page 281 of the 2014 Western Union annual report below. You can navigate through the pages in the report by either clicking on the pages listed below, or by using the keyword search tool below to find specific information within the annual report.-
 1
1 -
2
-
3
-
4
-
5
-
6
-
7
-
8
-
9
-
10
-
11
-
12
-
13
-
14
-
15
-
16
-
17
-
18
-
19
-
20
-
21
-
22
-
23
-
24
-
25
-
26
-
27
-
28
-
29
-
30
-
31
-
32
-
33
-
34
-
35
-
36
-
37
-
38
-
39
-
40
-
41
-
42
-
43
-
44
-
45
-
46
-
47
-
48
-
49
-
50
-
51
-
52
-
53
-
54
-
55
-
56
-
57
-
58
-
59
-
60
-
61
-
62
-
63
-
64
-
65
-
66
-
67
-
68
-
69
-
70
-
71
-
72
-
73
-
74
-
75
-
76
-
77
-
78
-
79
-
80
-
81
-
82
-
83
-
84
-
85
-
86
-
87
-
88
-
89
-
90
-
91
-
92
-
93
-
94
-
95
-
96
-
97
-
98
-
99
-
100
-
101
-
102
-
103
-
104
-
105
-
106
-
107
-
108
-
109
-
110
-
111
-
112
-
113
-
114
-
115
-
116
-
117
-
118
-
119
-
120
-
121
-
122
-
123
-
124
-
125
-
126
-
127
-
128
-
129
-
130
-
131
-
132
-
133
-
134
-
135
-
136
-
137
-
138
-
139
-
140
-
141
-
142
-
143
-
144
-
145
-
146
-
147
-
148
-
149
-
150
-
151
-
152
-
153
-
154
-
155
-
156
-
157
-
158
-
159
-
160
-
161
-
162
-
163
-
164
-
165
-
166
-
167
-
168
-
169
-
170
-
171
-
172
-
173
-
174
-
175
-
176
-
177
-
178
-
179
-
180
-
181
-
182
-
183
-
184
-
185
-
186
-
187
-
188
-
189
-
190
-
191
-
192
-
193
-
194
-
195
-
196
-
197
-
198
-
199
-
200
-
201
-
202
-
203
-
204
-
205
-
206
-
207
-
208
-
209
-
210
-
211
-
212
-
213
-
214
-
215
-
216
-
217
-
218
-
219
-
220
-
221
-
222
-
223
-
224
-
225
-
226
-
227
-
228
-
229
-
230
-
231
-
232
-
233
-
234
-
235
-
236
-
237
-
238
-
239
-
240
-
241
-
242
-
243
-
244
-
245
-
246
-
247
-
248
-
249
-
250
-
251
-
252
-
253
-
254
-
255
-
256
-
257
-
258
-
259
-
260
-
261
-
262
-
263
-
264
-
265
-
266
-
267
-
268
-
269
-
270
-
 271
271 -
 272
272 -
 273
273 -
 274
274 -
 275
275 -
 276
276 -
 277
277 -
 278
278 -
 279
279 -
 280
280 -
 281
281 -
 282
282 -
 283
283 -
 284
284 -
 285
285 -
 286
286 -
 287
287 -
 288
288 -
 289
289 -
 290
290 -
 291
291 -
292
-
293
-
294
-
295
-
296
-
297
-
298
-
299
-
300
-
301
-
302
-
303
-
304
-
305
-
306
 |
 |

2014 FORM 10-K
THE WESTERN UNION COMPANY
NOTES TO CONSOLIDATED FINANCIAL STATEMENTS (Continued)
143
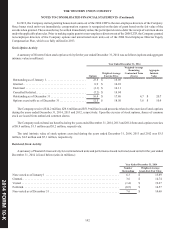
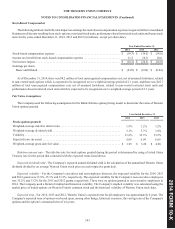
Stock-Based Compensation
The following table sets forth the total impact on earnings for stock-based compensation expense recognized in the Consolidated
Statements of Income resulting from stock options, restricted stock units, performance-based restricted stock units and bonus stock
units for the years ended December 31, 2014, 2013 and 2012 (in millions, except per share data).
Year Ended December 31,
2014 2013 2012
Stock-based compensation expense . . . . . . . . . . . . . . . . . . . . . . . . . . . . . . . . . . . . . . . . . . . . $ (39.7) $ (34.5) $ (34.0)
Income tax benefit from stock-based compensation expense . . . . . . . . . . . . . . . . . . . . . . . . . 11.5 10.0 10.0
Net income impact. . . . . . . . . . . . . . . . . . . . . . . . . . . . . . . . . . . . . . . . . . . . . . . . . . . . . . . . . . $ (28.2) $ (24.5) $ (24.0)
Earnings per share:
Basic and Diluted . . . . . . . . . . . . . . . . . . . . . . . . . . . . . . . . . . . . . . . . . . . . . . . . . . . . . . . . $ (0.05) $ (0.04) $ (0.04)
As of December 31, 2014, there was $8.2 million of total unrecognized compensation cost, net of assumed forfeitures, related
to non-vested stock options which is expected to be recognized over a weighted-average period of 2.1 years, and there was $45.7
million of total unrecognized compensation cost, net of assumed forfeitures, related to non-vested restricted stock units and
performance-based restricted stock units which is expected to be recognized over a weighted-average period of 2.3 years.
Fair Value Assumptions
The Company used the following assumptions for the Black-Scholes option pricing model to determine the value of Western
Union options granted.
Year Ended December 31,
2014 2013 2012
Stock options granted:
Weighted-average risk-free interest rate . . . . . . . . . . . . . . . . . . . . . . . . . . . . . . . . . . . . . . . . . 1.9% 1.2% 1.2%
Weighted-average dividend yield . . . . . . . . . . . . . . . . . . . . . . . . . . . . . . . . . . . . . . . . . . . . . . 3.1% 3.7% 1.8%
Volatility . . . . . . . . . . . . . . . . . . . . . . . . . . . . . . . . . . . . . . . . . . . . . . . . . . . . . . . . . . . . . . . . . 33.8% 35.3% 33.2%
Expected term (in years) . . . . . . . . . . . . . . . . . . . . . . . . . . . . . . . . . . . . . . . . . . . . . . . . . . . . . 6.09 6.09 6.09
Weighted-average grant date fair value. . . . . . . . . . . . . . . . . . . . . . . . . . . . . . . . . . . . . . . . . . $ 3.95 $ 3.20 $ 4.90
Risk-free interest rate - The risk-free rate for stock options granted during the period is determined by using a United States
Treasury rate for the period that coincided with the expected terms listed above.
Expected dividend yield - The Company's expected annual dividend yield is the calculation of the annualized Western Union
dividend divided by an average Western Union stock price on each respective grant date.
Expected volatility - For the Company's executives and non-employee directors, the expected volatility for the 2014, 2013
and 2012 grants was 33.8%, 35.3% and 33.2%, respectively. The expected volatility for the Company's non-executive employees
was 35.2% and 33.2% for the 2013 and 2012 grants, respectively. There were no options granted to non-executive employees in
2014. The Company used a blend of implied and historical volatility. The Company's implied volatility was calculated using the
market price of traded options on Western Union's common stock and the historical volatility of Western Union stock data.
Expected term - For 2014, 2013 and 2012, Western Union's expected term for all employees was approximately 6 years. The
Company's expected term of options was based upon, among other things, historical exercises, the vesting term of the Company's
options and the options' contractual term of ten years.