Western Union 2014 Annual Report Download - page 65
Download and view the complete annual report
Please find page 65 of the 2014 Western Union annual report below. You can navigate through the pages in the report by either clicking on the pages listed below, or by using the keyword search tool below to find specific information within the annual report.-
 1
1 -
2
-
3
-
4
-
5
-
6
-
7
-
8
-
9
-
10
-
11
-
12
-
13
-
14
-
15
-
16
-
17
-
18
-
19
-
20
-
21
-
22
-
23
-
24
-
25
-
26
-
27
-
28
-
29
-
30
-
31
-
32
-
33
-
34
-
35
-
36
-
37
-
38
-
39
-
40
-
41
-
42
-
43
-
44
-
45
-
46
-
47
-
48
-
49
-
50
-
51
-
52
-
53
-
54
-
 55
55 -
 56
56 -
 57
57 -
 58
58 -
 59
59 -
 60
60 -
 61
61 -
 62
62 -
 63
63 -
 64
64 -
 65
65 -
 66
66 -
 67
67 -
 68
68 -
 69
69 -
 70
70 -
 71
71 -
 72
72 -
 73
73 -
 74
74 -
 75
75 -
76
-
77
-
78
-
79
-
80
-
81
-
82
-
83
-
84
-
85
-
86
-
87
-
88
-
89
-
90
-
91
-
92
-
93
-
94
-
95
-
96
-
97
-
98
-
99
-
100
-
101
-
102
-
103
-
104
-
105
-
106
-
107
-
108
-
109
-
110
-
111
-
112
-
113
-
114
-
115
-
116
-
117
-
118
-
119
-
120
-
121
-
122
-
123
-
124
-
125
-
126
-
127
-
128
-
129
-
130
-
131
-
132
-
133
-
134
-
135
-
136
-
137
-
138
-
139
-
140
-
141
-
142
-
143
-
144
-
145
-
146
-
147
-
148
-
149
-
150
-
151
-
152
-
153
-
154
-
155
-
156
-
157
-
158
-
159
-
160
-
161
-
162
-
163
-
164
-
165
-
166
-
167
-
168
-
169
-
170
-
171
-
172
-
173
-
174
-
175
-
176
-
177
-
178
-
179
-
180
-
181
-
182
-
183
-
184
-
185
-
186
-
187
-
188
-
189
-
190
-
191
-
192
-
193
-
194
-
195
-
196
-
197
-
198
-
199
-
200
-
201
-
202
-
203
-
204
-
205
-
206
-
207
-
208
-
209
-
210
-
211
-
212
-
213
-
214
-
215
-
216
-
217
-
218
-
219
-
220
-
221
-
222
-
223
-
224
-
225
-
226
-
227
-
228
-
229
-
230
-
231
-
232
-
233
-
234
-
235
-
236
-
237
-
238
-
239
-
240
-
241
-
242
-
243
-
244
-
245
-
246
-
247
-
248
-
249
-
250
-
251
-
252
-
253
-
254
-
255
-
256
-
257
-
258
-
259
-
260
-
261
-
262
-
263
-
264
-
265
-
266
-
267
-
268
-
269
-
270
-
271
-
272
-
273
-
274
-
275
-
276
-
277
-
278
-
279
-
280
-
281
-
282
-
283
-
284
-
285
-
286
-
287
-
288
-
289
-
290
-
291
-
292
-
293
-
294
-
295
-
296
-
297
-
298
-
299
-
300
-
301
-
302
-
303
-
304
-
305
-
306
 |
 |

47 | The Western Union Company – Proxy Statement
NOTICE OF 2015 ANNUAL MEETING OF STOCKHOLDERS AND PROXY STATEMENT
Compensation Discussion and Analysis PROXY STATEMENT
150% of target and eliminating the restricted stock unit
component which was included in the 2013 Annual
Incentive Plan design. The Compensation Committee
approved the elimination of the restricted stock unit
component in order to simplify the plan design.
Target payout opportunities under the Annual Incentive
Plan are expressed as a percentage of a participant’s
annual base salary, with actual payouts ranging from 0%
to 150% of target for various levels of performance.
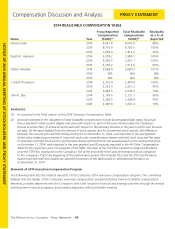
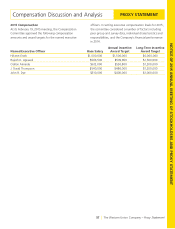
The following table sets forth each named executive
officer’s 2014 target award opportunity and the weighting
of the corporate, strategic and individual/business unit
measures used in determining the cash payout levels. For
2014, Messrs. Agrawal and Almeida received increases
in their target award opportunities in connection with
their respective promotions. Each of our other named
executive officer’s target award opportunity remained
unchanged from the level established for the executive
in 2012. As discussed further below, the weighting of
the performance measures reflects the desire of the
Compensation Committee to tie a significant portion of
annual incentive compensation to corporate performance
measures that the committee believes are meaningful to
and readily accessible by our investors while at the same
time emphasizing strategic performance objectives that
focus on the Company’s growth imperatives, and for the
named executive officers other than the Chief Executive
Officer, individual and/or business unit objectives that
the committee believes are indicators of the executive’s
success in fulfilling the executive’s responsibilities and
support the Company’s strategic operating plan.
Weighting of Performance Measures
Executive
Target Award
Opportunity Corporate Strategic
Individual/
Business Unit
Hikmet Ersek $1,500,000 80.0% 20.0% —
Rajesh K. Agrawal $446,918(1) 50.0% 20.0% 30.0%
Odilon Almeida $540,000 50.0% 20.0% 30.0%
J. David Thompson $450,000 50.0% 20.0% 30.0%
John R. Dye $400,000 50.0% 20.0% 30.0%
(1) In connection with his mid-year promotion to the position of Executive Vice President and Chief Financial Officer,
Mr. Agrawal’s target award opportunity was increased from $405,000 to $495,000. The amount reported in
the table reflects Mr. Agrawal’s prorated award opportunity for 2014.
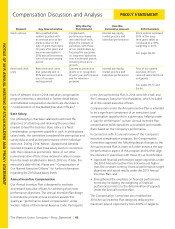
Financial Performance Metrics. As it had in previous
years, the Compensation Committee set the executives’
2014 annual incentive compensation award targets for
financial performance by establishing a grid based on
the Company’s revenue and operating income. These
performance measures were used in order to tie annual
incentive compensation to measures of the Company’s
financial performance that the committee deemed
meaningful to and readily accessible by our investors.
The Compensation Committee established the grid
metrics and corresponding payout percentages based
upon input from management regarding the Company’s
expected performance in the upcoming year. As noted
above, in order to drive performance above the Company’s
prior year results, the 2014 financial performance target
objectives were set higher than the constant currency
financial performance target objectives and actual results
under the 2013 Annual Incentive Plan. The committee
designed the grid to encourage strong, focused
performance by our executives with the maximum payout
levels requiring performance, measured on a constant
currency basis, that exceeds the Company’s financial
guidance. The 2014 grid provided a payout of 100% of
target if the Company achieved its internal operating
plan for operating income and revenue (revenue of
approximately $5.75 billion and operating income of
approximately $1.17 billion), with a maximum payout level
of 150% of target if revenue and operating income grew