Western Union 2014 Annual Report Download - page 233
Download and view the complete annual report
Please find page 233 of the 2014 Western Union annual report below. You can navigate through the pages in the report by either clicking on the pages listed below, or by using the keyword search tool below to find specific information within the annual report.-
 1
1 -
2
-
3
-
4
-
5
-
6
-
7
-
8
-
9
-
10
-
11
-
12
-
13
-
14
-
15
-
16
-
17
-
18
-
19
-
20
-
21
-
22
-
23
-
24
-
25
-
26
-
27
-
28
-
29
-
30
-
31
-
32
-
33
-
34
-
35
-
36
-
37
-
38
-
39
-
40
-
41
-
42
-
43
-
44
-
45
-
46
-
47
-
48
-
49
-
50
-
51
-
52
-
53
-
54
-
55
-
56
-
57
-
58
-
59
-
60
-
61
-
62
-
63
-
64
-
65
-
66
-
67
-
68
-
69
-
70
-
71
-
72
-
73
-
74
-
75
-
76
-
77
-
78
-
79
-
80
-
81
-
82
-
83
-
84
-
85
-
86
-
87
-
88
-
89
-
90
-
91
-
92
-
93
-
94
-
95
-
96
-
97
-
98
-
99
-
100
-
101
-
102
-
103
-
104
-
105
-
106
-
107
-
108
-
109
-
110
-
111
-
112
-
113
-
114
-
115
-
116
-
117
-
118
-
119
-
120
-
121
-
122
-
123
-
124
-
125
-
126
-
127
-
128
-
129
-
130
-
131
-
132
-
133
-
134
-
135
-
136
-
137
-
138
-
139
-
140
-
141
-
142
-
143
-
144
-
145
-
146
-
147
-
148
-
149
-
150
-
151
-
152
-
153
-
154
-
155
-
156
-
157
-
158
-
159
-
160
-
161
-
162
-
163
-
164
-
165
-
166
-
167
-
168
-
169
-
170
-
171
-
172
-
173
-
174
-
175
-
176
-
177
-
178
-
179
-
180
-
181
-
182
-
183
-
184
-
185
-
186
-
187
-
188
-
189
-
190
-
191
-
192
-
193
-
194
-
195
-
196
-
197
-
198
-
199
-
200
-
201
-
202
-
203
-
204
-
205
-
206
-
207
-
208
-
209
-
210
-
211
-
212
-
213
-
214
-
215
-
216
-
217
-
218
-
219
-
220
-
221
-
222
-
 223
223 -
 224
224 -
 225
225 -
 226
226 -
 227
227 -
 228
228 -
 229
229 -
 230
230 -
 231
231 -
 232
232 -
 233
233 -
 234
234 -
 235
235 -
 236
236 -
 237
237 -
 238
238 -
 239
239 -
 240
240 -
 241
241 -
 242
242 -
 243
243 -
244
-
245
-
246
-
247
-
248
-
249
-
250
-
251
-
252
-
253
-
254
-
255
-
256
-
257
-
258
-
259
-
260
-
261
-
262
-
263
-
264
-
265
-
266
-
267
-
268
-
269
-
270
-
271
-
272
-
273
-
274
-
275
-
276
-
277
-
278
-
279
-
280
-
281
-
282
-
283
-
284
-
285
-
286
-
287
-
288
-
289
-
290
-
291
-
292
-
293
-
294
-
295
-
296
-
297
-
298
-
299
-
300
-
301
-
302
-
303
-
304
-
305
-
306
 |
 |

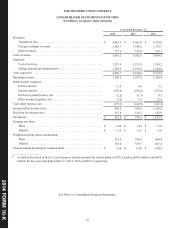
2014 FORM 10-K
95
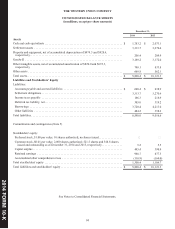
THE WESTERN UNION COMPANY
CONSOLIDATED STATEMENTS OF CASH FLOWS
(in millions)
Year Ended December 31,
2014 2013 2012
Cash flows from operating activities
Net income . . . . . . . . . . . . . . . . . . . . . . . . . . . . . . . . . . . . . . . . . . . . . . . . . . . . . . . . . . . . . . $ 852.4 $ 798.4 $ 1,025.9
Adjustments to reconcile net income to net cash provided by operating activities:
Depreciation. . . . . . . . . . . . . . . . . . . . . . . . . . . . . . . . . . . . . . . . . . . . . . . . . . . . . . . . . . . . 66.6 64.2 61.7
Amortization . . . . . . . . . . . . . . . . . . . . . . . . . . . . . . . . . . . . . . . . . . . . . . . . . . . . . . . . . . . 205.3 198.6 184.4
Deferred income tax benefit. . . . . . . . . . . . . . . . . . . . . . . . . . . . . . . . . . . . . . . . . . . . . . . . (26.8)(39.3)(35.2)
Other non-cash items, net . . . . . . . . . . . . . . . . . . . . . . . . . . . . . . . . . . . . . . . . . . . . . . . . . 49.5 53.3 77.2
Increase/(decrease) in cash, excluding the effects of acquisitions, resulting from
changes in:
Other assets . . . . . . . . . . . . . . . . . . . . . . . . . . . . . . . . . . . . . . . . . . . . . . . . . . . . . . . . . . (31.1)(55.4)(27.8)
Accounts payable and accrued liabilities . . . . . . . . . . . . . . . . . . . . . . . . . . . . . . . . . . . (29.4) 81.1 9.3
Income taxes payable (Note 10) . . . . . . . . . . . . . . . . . . . . . . . . . . . . . . . . . . . . . . . . . . (39.3) 3.4 (79.9)
Other liabilities . . . . . . . . . . . . . . . . . . . . . . . . . . . . . . . . . . . . . . . . . . . . . . . . . . . . . . . (1.3)(15.7)(30.3)
Net cash provided by operating activities . . . . . . . . . . . . . . . . . . . . . . . . . . . . . . . . . . . . . . 1,045.9 1,088.6 1,185.3
Cash flows from investing activities
Capitalization of contract costs . . . . . . . . . . . . . . . . . . . . . . . . . . . . . . . . . . . . . . . . . . . . . . (73.1)(119.3)(174.9)
Capitalization of purchased and developed software. . . . . . . . . . . . . . . . . . . . . . . . . . . . . . (38.1)(41.8)(32.4)
Purchases of property and equipment . . . . . . . . . . . . . . . . . . . . . . . . . . . . . . . . . . . . . . . . . (67.8)(80.2)(60.9)
Purchases of non-settlement related investments. . . . . . . . . . . . . . . . . . . . . . . . . . . . . . . . . — (100.0) —
Proceeds from sale of non-settlement related investments . . . . . . . . . . . . . . . . . . . . . . . . . 100.2 — —
Acquisition of businesses, net (Note 4) . . . . . . . . . . . . . . . . . . . . . . . . . . . . . . . . . . . . . . . . (10.6) — 10.0
Net cash used in investing activities . . . . . . . . . . . . . . . . . . . . . . . . . . . . . . . . . . . . . . . . . . (89.4)(341.3)(258.2)
Cash flows from financing activities
Proceeds from exercise of options . . . . . . . . . . . . . . . . . . . . . . . . . . . . . . . . . . . . . . . . . . . . 14.2 28.9 53.4
Cash dividends paid . . . . . . . . . . . . . . . . . . . . . . . . . . . . . . . . . . . . . . . . . . . . . . . . . . . . . . . (265.2)(277.2)(254.2)
Common stock repurchased (Note 13). . . . . . . . . . . . . . . . . . . . . . . . . . . . . . . . . . . . . . . . . (495.4)(399.7)(766.5)
Net repayments of commercial paper. . . . . . . . . . . . . . . . . . . . . . . . . . . . . . . . . . . . . . . . . . — — (297.0)
Net proceeds from issuance of borrowings . . . . . . . . . . . . . . . . . . . . . . . . . . . . . . . . . . . . . — 497.3 742.8
Principal payments on borrowings. . . . . . . . . . . . . . . . . . . . . . . . . . . . . . . . . . . . . . . . . . . . (500.0)(300.0) —
Net cash used in financing activities . . . . . . . . . . . . . . . . . . . . . . . . . . . . . . . . . . . . . . . . . . (1,246.4)(450.7)(521.5)
Net change in cash and cash equivalents . . . . . . . . . . . . . . . . . . . . . . . . . . . . . . . . . . . . . . . (289.9) 296.6 405.6
Cash and cash equivalents at beginning of year. . . . . . . . . . . . . . . . . . . . . . . . . . . . . . . . . . 2,073.1 1,776.5 1,370.9
Cash and cash equivalents at end of year. . . . . . . . . . . . . . . . . . . . . . . . . . . . . . . . . . . . . . . $ 1,783.2 $ 2,073.1 $ 1,776.5
Supplemental cash flow information:
Interest paid . . . . . . . . . . . . . . . . . . . . . . . . . . . . . . . . . . . . . . . . . . . . . . . . . . . . . . . . . . . . . $ 170.8 $ 193.7 $ 181.8
Income taxes paid (Note 10) . . . . . . . . . . . . . . . . . . . . . . . . . . . . . . . . . . . . . . . . . . . . . . . . $ 179.4 $ 158.0 $ 257.1
See Notes to Consolidated Financial Statements.