Western Union 2014 Annual Report Download - page 206
Download and view the complete annual report
Please find page 206 of the 2014 Western Union annual report below. You can navigate through the pages in the report by either clicking on the pages listed below, or by using the keyword search tool below to find specific information within the annual report.-
 1
1 -
2
-
3
-
4
-
5
-
6
-
7
-
8
-
9
-
10
-
11
-
12
-
13
-
14
-
15
-
16
-
17
-
18
-
19
-
20
-
21
-
22
-
23
-
24
-
25
-
26
-
27
-
28
-
29
-
30
-
31
-
32
-
33
-
34
-
35
-
36
-
37
-
38
-
39
-
40
-
41
-
42
-
43
-
44
-
45
-
46
-
47
-
48
-
49
-
50
-
51
-
52
-
53
-
54
-
55
-
56
-
57
-
58
-
59
-
60
-
61
-
62
-
63
-
64
-
65
-
66
-
67
-
68
-
69
-
70
-
71
-
72
-
73
-
74
-
75
-
76
-
77
-
78
-
79
-
80
-
81
-
82
-
83
-
84
-
85
-
86
-
87
-
88
-
89
-
90
-
91
-
92
-
93
-
94
-
95
-
96
-
97
-
98
-
99
-
100
-
101
-
102
-
103
-
104
-
105
-
106
-
107
-
108
-
109
-
110
-
111
-
112
-
113
-
114
-
115
-
116
-
117
-
118
-
119
-
120
-
121
-
122
-
123
-
124
-
125
-
126
-
127
-
128
-
129
-
130
-
131
-
132
-
133
-
134
-
135
-
136
-
137
-
138
-
139
-
140
-
141
-
142
-
143
-
144
-
145
-
146
-
147
-
148
-
149
-
150
-
151
-
152
-
153
-
154
-
155
-
156
-
157
-
158
-
159
-
160
-
161
-
162
-
163
-
164
-
165
-
166
-
167
-
168
-
169
-
170
-
171
-
172
-
173
-
174
-
175
-
176
-
177
-
178
-
179
-
180
-
181
-
182
-
183
-
184
-
185
-
186
-
187
-
188
-
189
-
190
-
191
-
192
-
193
-
194
-
195
-
 196
196 -
 197
197 -
 198
198 -
 199
199 -
 200
200 -
 201
201 -
 202
202 -
 203
203 -
 204
204 -
 205
205 -
 206
206 -
 207
207 -
 208
208 -
 209
209 -
 210
210 -
 211
211 -
 212
212 -
 213
213 -
 214
214 -
 215
215 -
 216
216 -
217
-
218
-
219
-
220
-
221
-
222
-
223
-
224
-
225
-
226
-
227
-
228
-
229
-
230
-
231
-
232
-
233
-
234
-
235
-
236
-
237
-
238
-
239
-
240
-
241
-
242
-
243
-
244
-
245
-
246
-
247
-
248
-
249
-
250
-
251
-
252
-
253
-
254
-
255
-
256
-
257
-
258
-
259
-
260
-
261
-
262
-
263
-
264
-
265
-
266
-
267
-
268
-
269
-
270
-
271
-
272
-
273
-
274
-
275
-
276
-
277
-
278
-
279
-
280
-
281
-
282
-
283
-
284
-
285
-
286
-
287
-
288
-
289
-
290
-
291
-
292
-
293
-
294
-
295
-
296
-
297
-
298
-
299
-
300
-
301
-
302
-
303
-
304
-
305
-
306
 |
 |

2014 FORM 10-K
68
Fluctuations in the exchange rate between the United States dollar and other currencies resulted in a reduction to transaction
fees and foreign exchange revenues for the year ended December 31, 2013 of $29.6 million over the same period in the previous
year, net of foreign currency hedges, that would not have occurred had there been constant currency rates.
Operating income
2014 compared to 2013
Consumer-to-Consumer operating income increased 2% during the year ended December 31, 2014 compared to the prior year
primarily due to the revenue increases described above and benefits from our productivity and cost-savings initiatives. These
increases were partially offset by higher agent commissions, which generally increase as revenue increases, including increases
in agent commission rates in our walk-in services primarily due to the renewal of certain strategic agent agreements, and increased
compliance program costs. The change in operating income margins in the segment was due to the same factors mentioned above.
2013 compared to 2012
Consumer-to-Consumer operating income declined 19% during the year ended December 31, 2013 compared to the prior year
primarily due to the investments in our strategic initiatives, the revenue decline described earlier, increased compliance program
costs, lower compensation expense in 2012, and expenses associated with our productivity and cost savings initiatives, partially
offset by savings from these initiatives and decreased marketing expenses. The change in operating income margins in the segment
was due to the same factors mentioned above.
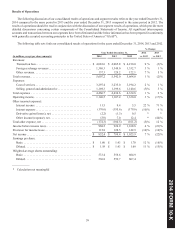
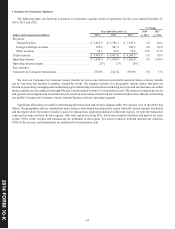
Consumer-to-Business Segment
The following table sets forth our Consumer-to-Business segment results of operations for the years ended December 31,
2014, 2013 and 2012.
% Change
Year Ended December 31, 2014 2013
(dollars in millions) 2014 2013 2012 vs. 2013 vs. 2012
Revenues:
Transaction fees . . . . . . . . . . . . . . . . . . . . . . . . . . . . . . . . . . . . $ 572.7 $ 579.1 $ 573.6 (1)% 1 %
Foreign exchange and other revenues . . . . . . . . . . . . . . . . . . . 26.1 29.4 30.3 (11)% (3)%
Total revenues . . . . . . . . . . . . . . . . . . . . . . . . . . . . . . . . . . . . . . . . $ 598.8 $ 608.5 $ 603.9 (2)% 1 %
Operating income . . . . . . . . . . . . . . . . . . . . . . . . . . . . . . . . . . . . . $ 98.7 $ 121.9 $ 137.6 (19)% (11)%
Operating income margin . . . . . . . . . . . . . . . . . . . . . . . . . . . . . . . 16% 20% 23%
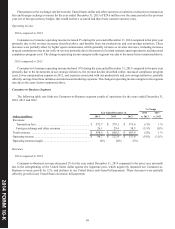
Revenues
2014 compared to 2013
Consumer-to-Business revenue decreased 2% for the year ended December 31, 2014 compared to the prior year, primarily
due to the strengthening of the United States dollar against the Argentine peso, which negatively impacted our Consumer-to-
Business revenue growth by 12%, and declines in our United States cash-based bill payments. These decreases were partially
offset by growth in our United States electronic bill payments.