Western Union 2014 Annual Report Download - page 60
Download and view the complete annual report
Please find page 60 of the 2014 Western Union annual report below. You can navigate through the pages in the report by either clicking on the pages listed below, or by using the keyword search tool below to find specific information within the annual report.-
 1
1 -
2
-
3
-
4
-
5
-
6
-
7
-
8
-
9
-
10
-
11
-
12
-
13
-
14
-
15
-
16
-
17
-
18
-
19
-
20
-
21
-
22
-
23
-
24
-
25
-
26
-
27
-
28
-
29
-
30
-
31
-
32
-
33
-
34
-
35
-
36
-
37
-
38
-
39
-
40
-
41
-
42
-
43
-
44
-
45
-
46
-
47
-
48
-
49
-
 50
50 -
 51
51 -
 52
52 -
 53
53 -
 54
54 -
 55
55 -
 56
56 -
 57
57 -
 58
58 -
 59
59 -
 60
60 -
 61
61 -
 62
62 -
 63
63 -
 64
64 -
 65
65 -
 66
66 -
 67
67 -
 68
68 -
 69
69 -
 70
70 -
71
-
72
-
73
-
74
-
75
-
76
-
77
-
78
-
79
-
80
-
81
-
82
-
83
-
84
-
85
-
86
-
87
-
88
-
89
-
90
-
91
-
92
-
93
-
94
-
95
-
96
-
97
-
98
-
99
-
100
-
101
-
102
-
103
-
104
-
105
-
106
-
107
-
108
-
109
-
110
-
111
-
112
-
113
-
114
-
115
-
116
-
117
-
118
-
119
-
120
-
121
-
122
-
123
-
124
-
125
-
126
-
127
-
128
-
129
-
130
-
131
-
132
-
133
-
134
-
135
-
136
-
137
-
138
-
139
-
140
-
141
-
142
-
143
-
144
-
145
-
146
-
147
-
148
-
149
-
150
-
151
-
152
-
153
-
154
-
155
-
156
-
157
-
158
-
159
-
160
-
161
-
162
-
163
-
164
-
165
-
166
-
167
-
168
-
169
-
170
-
171
-
172
-
173
-
174
-
175
-
176
-
177
-
178
-
179
-
180
-
181
-
182
-
183
-
184
-
185
-
186
-
187
-
188
-
189
-
190
-
191
-
192
-
193
-
194
-
195
-
196
-
197
-
198
-
199
-
200
-
201
-
202
-
203
-
204
-
205
-
206
-
207
-
208
-
209
-
210
-
211
-
212
-
213
-
214
-
215
-
216
-
217
-
218
-
219
-
220
-
221
-
222
-
223
-
224
-
225
-
226
-
227
-
228
-
229
-
230
-
231
-
232
-
233
-
234
-
235
-
236
-
237
-
238
-
239
-
240
-
241
-
242
-
243
-
244
-
245
-
246
-
247
-
248
-
249
-
250
-
251
-
252
-
253
-
254
-
255
-
256
-
257
-
258
-
259
-
260
-
261
-
262
-
263
-
264
-
265
-
266
-
267
-
268
-
269
-
270
-
271
-
272
-
273
-
274
-
275
-
276
-
277
-
278
-
279
-
280
-
281
-
282
-
283
-
284
-
285
-
286
-
287
-
288
-
289
-
290
-
291
-
292
-
293
-
294
-
295
-
296
-
297
-
298
-
299
-
300
-
301
-
302
-
303
-
304
-
305
-
306
 |
 |

Compensation Discussion and Analysis PROXY STATEMENT
The Western Union Company – Proxy Statement | 42
NOTICE OF 2015 ANNUAL MEETING OF STOCKHOLDERS AND PROXY STATEMENT
(which included data from 56 companies with annual
revenuesbetween$5billionand$10billion);Equilar
Top 25 (which included custom data from 12 of the
companies in the Company’s peer group described above:
Ameriprise Financial, Automatic Data Processing, Charles
Schwab, CME Group, Discover Financial Services, eBay,
Fidelity National Information Services, Global Payments,
MoneyGram, NASDAQ OMX, State Street and Total
Systems Services); AonHewitt 2013 US Total Compensation
Measurement Database (which included data from 59
companieswithannualrevenuesbetween$5billionand
$10billion);and2013TowersWatsonU.S.Compensation
Data Bank General Industry Executive Database (which
included data from 112 companies with annual revenues
between$3billionand$6billion).
In connection with Mr. Almeida’s 2014 compensation
review, the committee considered compensation
information from the 2013 Towers Watson U.S.
Compensation Data Bank General Industry Executive
Compensation Database (which included data from
119 companies with annual revenues greater than
$2billion);2013MercerBenchmarkDatabase-Executive
(which included data from 24 companies with annual
revenuesbetween$2.5billionand$5billion);AonHewitt
2013 US Total Compensation Measurement Database
(which included data from 69 companies with annual
revenuesbetween$2.5billionand$5billion);andEquilar
– President America & Europe Compensation Survey
(which included data from three companies with a median
annualrevenueof$2.9billion).In doing so, the committee
sought to reference data for executives in a similar role as
Mr. Almeida who oversee organizations of comparable
size and revenue. In connection with Mr. Agrawal’s
mid-year promotion, the committee considered survey
data provided by the Compensation Consultant using
the Mercer, Towers Watson, and AonHewitt surveys
referenced above (which included 16 publicly-traded peer
companies in payment processing and digital services)
and also considered supplemental information for chief
financial officers in financial services organizations similar
in size and revenue to the Company (which included
information from the 2013 Towers Watson CBD Financial
Services Executive Compensation survey that included 46
companieswithannualrevenueof$7billionormorein
the financial services industry).
Use of Tally Sheets
The Compensation Committee reviews tally sheets that
present compensation data for each of the Company’s
executives. These tally sheets generally include historical
and current compensation data, valuations of future
equity vesting, value of option exercises in the past five
years as well as analyses for hypothetical terminations
and retirements to allow the Compensation Committee
to consider the Company’s obligations under such
circumstances. The tally sheets provide context for the
committee in determining the elements and amounts of
compensation paid.
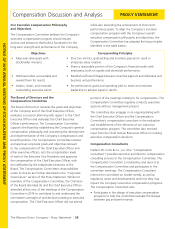
The Western Union Executive Compensation Program
Pay-For-Performance
The principal components of the Company’s annual
executive compensation program are annual base salary,
annual incentive awards, and long-term incentive awards
in the form of stock options and performance-based
restricted stock units. The Compensation Committee
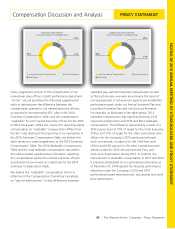
designed the 2014 executive compensation program so
that performance-based pay elements (Annual Incentive
Plan awards, stock options and performance-based
restricted stock units) constituted a significant portion
of the executive compensation awarded, determined
at target levels. The following charts demonstrate that
these variable pay elements comprised approximately
88% of the targeted annual compensation for the
Chief Executive Officer and, on average, 75% of the
targeted annual compensation for the other named
executive officers (excluding the 2014 promotion and
retention/merit restricted stock unit grants to such
executives). For purposes of these charts, the percentage
of targeted annual compensation was determined
based on the annual base salary and target incentive
opportunities applicable to the named executive officer as
of December 31, 2014.