Western Union 2014 Annual Report Download - page 50
Download and view the complete annual report
Please find page 50 of the 2014 Western Union annual report below. You can navigate through the pages in the report by either clicking on the pages listed below, or by using the keyword search tool below to find specific information within the annual report.-
 1
1 -
 2
2 -
 3
3 -
 4
4 -
 5
5 -
 6
6 -
 7
7 -
 8
8 -
 9
9 -
 10
10 -
 11
11 -
 12
12 -
 13
13 -
 14
14 -
 15
15 -
 16
16 -
 17
17 -
 18
18 -
 19
19 -
 20
20 -
 21
21 -
 22
22 -
 23
23 -
 24
24 -
 25
25 -
 26
26 -
 27
27 -
 28
28 -
 29
29 -
 30
30 -
 31
31 -
 32
32 -
 33
33 -
 34
34 -
 35
35 -
 36
36 -
 37
37 -
 38
38 -
 39
39 -
 40
40 -
 41
41 -
 42
42 -
 43
43 -
 44
44 -
 45
45 -
 46
46 -
 47
47 -
 48
48 -
 49
49 -
 50
50 -
 51
51 -
 52
52 -
 53
53 -
 54
54 -
 55
55 -
 56
56 -
 57
57 -
 58
58 -
 59
59 -
 60
60 -
 61
61 -
 62
62 -
 63
63 -
 64
64 -
 65
65 -
 66
66 -
 67
67 -
 68
68 -
 69
69 -
 70
70 -
 71
71 -
 72
72 -
 73
73 -
 74
74 -
 75
75 -
 76
76 -
 77
77 -
 78
78 -
 79
79 -
 80
80 -
 81
81 -
 82
82 -
 83
83 -
 84
84 -
 85
85 -
 86
86 -
 87
87 -
 88
88 -
 89
89 -
 90
90 -
 91
91 -
 92
92 -
 93
93 -
 94
94 -
 95
95 -
 96
96 -
 97
97 -
 98
98 -
 99
99 -
 100
100 -
 101
101 -
 102
102 -
 103
103 -
 104
104 -
 105
105 -
 106
106 -
 107
107 -
 108
108 -
 109
109 -
 110
110 -
 111
111 -
 112
112 -
 113
113 -
 114
114 -
 115
115 -
 116
116 -
 117
117 -
 118
118 -
 119
119 -
 120
120 -
 121
121 -
 122
122 -
 123
123 -
 124
124 -
 125
125 -
 126
126 -
 127
127 -
 128
128 -
 129
129 -
 130
130 -
 131
131 -
 132
132 -
 133
133 -
 134
134 -
 135
135 -
 136
136 -
 137
137 -
 138
138 -
 139
139 -
 140
140 -
 141
141 -
 142
142 -
 143
143 -
 144
144 -
 145
145 -
 146
146 -
 147
147 -
 148
148 -
 149
149 -
 150
150 -
 151
151 -
 152
152 -
 153
153 -
 154
154 -
 155
155 -
 156
156 -
 157
157 -
 158
158 -
 159
159 -
 160
160 -
 161
161 -
 162
162 -
 163
163 -
 164
164 -
 165
165 -
 166
166 -
 167
167 -
 168
168 -
 169
169 -
 170
170 -
 171
171 -
 172
172 -
 173
173 -
 174
174 -
 175
175 -
 176
176 -
 177
177 -
 178
178 -
 179
179 -
 180
180 -
 181
181 -
 182
182 -
 183
183 -
 184
184 -
 185
185 -
 186
186 -
 187
187 -
 188
188 -
 189
189 -
 190
190 -
 191
191 -
 192
192 -
 193
193 -
 194
194 -
 195
195 -
 196
196 -
 197
197 -
 198
198 -
 199
199 -
 200
200 -
 201
201 -
 202
202 -
 203
203 -
 204
204 -
 205
205 -
 206
206 -
 207
207 -
 208
208 -
 209
209 -
 210
210 -
 211
211 -
 212
212 -
 213
213 -
 214
214 -
 215
215 -
 216
216 -
 217
217 -
 218
218 -
 219
219 -
 220
220 -
 221
221 -
 222
222 -
 223
223 -
 224
224 -
 225
225 -
 226
226 -
 227
227 -
 228
228 -
 229
229 -
 230
230 -
 231
231 -
 232
232 -
 233
233 -
 234
234 -
 235
235 -
 236
236 -
 237
237 -
 238
238 -
 239
239 -
 240
240 -
 241
241 -
 242
242 -
 243
243 -
 244
244 -
 245
245 -
 246
246 -
 247
247 -
 248
248 -
 249
249 -
 250
250 -
 251
251 -
 252
252 -
 253
253 -
 254
254 -
 255
255 -
 256
256 -
 257
257 -
 258
258 -
 259
259 -
 260
260 -
 261
261 -
 262
262 -
 263
263 -
 264
264 -
 265
265 -
 266
266 -
 267
267 -
 268
268 -
 269
269 -
 270
270 -
 271
271 -
 272
272 -
 273
273 -
 274
274 -
 275
275 -
 276
276 -
 277
277 -
 278
278 -
 279
279 -
 280
280 -
 281
281 -
 282
282 -
 283
283 -
 284
284 -
 285
285 -
 286
286 -
 287
287 -
 288
288 -
 289
289 -
 290
290 -
 291
291 -
 292
292 -
 293
293 -
 294
294 -
 295
295 -
 296
296 -
 297
297 -
 298
298 -
 299
299 -
 300
300 -
 301
301 -
 302
302 -
 303
303 -
 304
304 -
 305
305 -
 306
306
 |
 |

Compensation Discussion and Analysis PROXY STATEMENT
The Western Union Company – Proxy Statement | 32
NOTICE OF 2015 ANNUAL MEETING OF STOCKHOLDERS AND PROXY STATEMENT
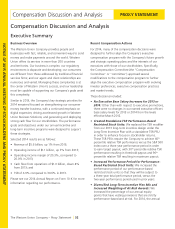
Compensation Discussion and Analysis
Executive Summary
Business Overview
The Western Union Company provides people and
businesses with fast, reliable, and convenient ways to send
money and make payments around the world. Western
Union offers its services in more than 200 countries
and territories. Our business is complex: our regulatory
environment is disparate and developing; our consumers
are different from those addressed by traditional financial
services firms; and our agent and client relationships are
numerous and varied. Managing these complexities is at
the center of Western Union’s success, and our leadership
must be capable of supporting our Company’s goals amid
this complexity.
Similar to 2013, the Company’s key strategic priorities for
2014 remained focused on strengthening our consumer
money transfer business, with a continued emphasis on
digital expansion; driving accelerated growth in Western
Union Business Solutions; and generating and deploying
strong cash flow for our stockholders. The performance
goals and objectives under our annual incentive and
long-term incentive programs were designed to support
these strategies.
Selected 2014 results are as follows:
• Revenueof$5.6 billion, up 1% from 2013;
• Operatingincomeof$1.1 billion, up 3% from 2013;
• Operatingincomemarginof20.3%, compared to
20.0% in 2013;
• Cashflowfromoperationsof$1.0 billion, down 4%
from 2013; and
• TSR of 6.9% compared to 30.6% in 2013.
Please see our 2014 Annual Report on Form 10-K for more
information regarding our performance.
Recent Compensation Actions
For 2014, many of the compensation decisions were
designed to further align the Company’s executive
compensation program with the Company’s future growth
and strategic operating plans and the interests of our
executives with those of our stockholders. Specifically,
the Compensation Committee (the “Compensation
Committee” or “committee”) approved several
modifications to the compensation program to further
align the executive compensation program with evolving
investor preferences, executive compensation practices
and market trends.
These decisions included:
• No Executive Base Salary Increases for 2013 or
2014: Other than with respect to executive promotions,
there were no changes in our named executive officers’
base salary levels for 2013 or 2014 from the levels
effective March 2012.
• Created Standalone TSR Performance-Based
Restricted Stock Units: We replaced the TSR modifier
from our 2013 long-term incentive design under the
Long-Term Incentive Plan with a standalone TSR PSU
in order to enhance focus on stockholder returns.
These TSR PSUs require the Company to achieve 60th
percentile relative TSR performance versus the S&P 500
Index over a three-year performance period in order
to earn target payout, with 30th percentile relative TSR
performance resulting in threshold payout and 90th
percentile relative TSR resulting in maximum payout.
• Increased Performance Period for Performance-
Based Restricted Stock Units: We increased the
performance period of our performance-based
restricted stock units so that they will be subject to
a three-year total performance period, versus the
two-year performance period used in prior years.
• Diversified Long-Term Incentive Plan Mix and
Increased Weighting of At-Risk Awards: We
increased the percentage of our annual equity
grants that have vesting provisions that are strictly
performance-based and at-risk. For 2014, the annual
