Western Union 2014 Annual Report Download - page 217
Download and view the complete annual report
Please find page 217 of the 2014 Western Union annual report below. You can navigate through the pages in the report by either clicking on the pages listed below, or by using the keyword search tool below to find specific information within the annual report.-
 1
1 -
2
-
3
-
4
-
5
-
6
-
7
-
8
-
9
-
10
-
11
-
12
-
13
-
14
-
15
-
16
-
17
-
18
-
19
-
20
-
21
-
22
-
23
-
24
-
25
-
26
-
27
-
28
-
29
-
30
-
31
-
32
-
33
-
34
-
35
-
36
-
37
-
38
-
39
-
40
-
41
-
42
-
43
-
44
-
45
-
46
-
47
-
48
-
49
-
50
-
51
-
52
-
53
-
54
-
55
-
56
-
57
-
58
-
59
-
60
-
61
-
62
-
63
-
64
-
65
-
66
-
67
-
68
-
69
-
70
-
71
-
72
-
73
-
74
-
75
-
76
-
77
-
78
-
79
-
80
-
81
-
82
-
83
-
84
-
85
-
86
-
87
-
88
-
89
-
90
-
91
-
92
-
93
-
94
-
95
-
96
-
97
-
98
-
99
-
100
-
101
-
102
-
103
-
104
-
105
-
106
-
107
-
108
-
109
-
110
-
111
-
112
-
113
-
114
-
115
-
116
-
117
-
118
-
119
-
120
-
121
-
122
-
123
-
124
-
125
-
126
-
127
-
128
-
129
-
130
-
131
-
132
-
133
-
134
-
135
-
136
-
137
-
138
-
139
-
140
-
141
-
142
-
143
-
144
-
145
-
146
-
147
-
148
-
149
-
150
-
151
-
152
-
153
-
154
-
155
-
156
-
157
-
158
-
159
-
160
-
161
-
162
-
163
-
164
-
165
-
166
-
167
-
168
-
169
-
170
-
171
-
172
-
173
-
174
-
175
-
176
-
177
-
178
-
179
-
180
-
181
-
182
-
183
-
184
-
185
-
186
-
187
-
188
-
189
-
190
-
191
-
192
-
193
-
194
-
195
-
196
-
197
-
198
-
199
-
200
-
201
-
202
-
203
-
204
-
205
-
206
-
 207
207 -
 208
208 -
 209
209 -
 210
210 -
 211
211 -
 212
212 -
 213
213 -
 214
214 -
 215
215 -
 216
216 -
 217
217 -
 218
218 -
 219
219 -
 220
220 -
 221
221 -
 222
222 -
 223
223 -
 224
224 -
 225
225 -
 226
226 -
 227
227 -
228
-
229
-
230
-
231
-
232
-
233
-
234
-
235
-
236
-
237
-
238
-
239
-
240
-
241
-
242
-
243
-
244
-
245
-
246
-
247
-
248
-
249
-
250
-
251
-
252
-
253
-
254
-
255
-
256
-
257
-
258
-
259
-
260
-
261
-
262
-
263
-
264
-
265
-
266
-
267
-
268
-
269
-
270
-
271
-
272
-
273
-
274
-
275
-
276
-
277
-
278
-
279
-
280
-
281
-
282
-
283
-
284
-
285
-
286
-
287
-
288
-
289
-
290
-
291
-
292
-
293
-
294
-
295
-
296
-
297
-
298
-
299
-
300
-
301
-
302
-
303
-
304
-
305
-
306
 |
 |

2014 FORM 10-K
79
Pension Plan
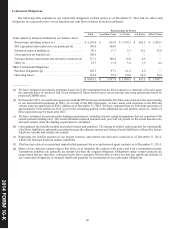
We have a frozen defined benefit pension plan ("Plan"), for which we had a recorded unfunded pension obligation of $74.9
million and $70.4 million as of December 31, 2014 and 2013, respectively. During the years ended December 31, 2014 and 2013,
we made contributions of $13.2 million and $15.7 million, respectively, to the Plan. We will be required to fund approximately
$18 million to the Plan in 2015.
Our most recent measurement date for our pension plan was December 31, 2014. The calculation of the funded status and net
periodic benefit cost is dependent upon three primary assumptions: 1) expected long-term return on plan assets; 2) discount rate;
and 3) life expectancy trends.
We employ a building block approach in determining the long-term rate of return for plan assets. Historical markets are studied
and long-term historical risk, return, and co-variance relationships between equities, fixed-income securities, and alternative
investments are considered consistent with the widely accepted capital market principle that assets with higher volatility generate
a greater return over the long run. Current market factors such as inflation and interest rates are evaluated before long-term capital
market assumptions are determined. Consideration is given to diversification, re-balancing and yields anticipated on fixed income
securities held. Historical returns are reviewed within the context of current economic conditions to check for reasonableness and
appropriateness. We then apply this rate against a calculated value for our plan assets. The calculated value recognizes changes
in the fair value of plan assets over a five-year period. Our expected long-term return on plan assets was 7.00% for both 2014 and
2013. The expected long-term return on plan assets is 7.00% for 2015. As of our December 31, 2014 measurement date, pension
plan target allocations were approximately 20% in equity investments, 60% in debt securities and 20% in alternative investment
strategies (e.g. hedge funds, royalty rights and private equity funds). Hedge fund strategy types include, but are not limited to:
equity long/short, commodities/currencies, relative value, event driven and multi-strategy. The Plan holds interest rate derivative
contracts directly, including interest rate futures that are based on U.S. Treasury bond rates ranging from two years to twenty-five
years. The Plan may also hold interest rate swaps, under which the Plan is committed to pay or receive a short-term LIBOR-based
variable interest rate in exchange for a fixed interest rate, primarily based on five and ten-year maturities. Additionally, derivatives
are held indirectly through funds in which the Plan is invested. Derivatives are used by the Plan to help reduce the Plan's exposure
to interest rate volatility and to provide an additional source of return. Cash held by the Plan is used to satisfy margin requirements
on the derivatives or meet liquidity needs, including benefit payments. Investment risk is measured and monitored on an ongoing
basis through quarterly investment portfolio reviews, annual liability measurements, and periodic asset and liability studies.
The discount rate assumption is set based on the rate at which the pension benefits could be settled effectively. The discount
rate is determined by matching the timing and amount of anticipated payouts under the Plan to the rates from an AA spot rate yield
curve. The curve is derived from AA bonds of varying maturities. The discount rate assumption for our benefit obligation was
3.27% and 3.91% as of December 31, 2014 and 2013, respectively. A 100 basis point change to both the discount rate and long-
term rate of return on plan assets would not have a material impact to our annual pension expense.
The assumptions related to life expectancy are used to estimate the expected period over which pension benefits will be
required to be paid. Projections used for life expectancy are based on mortality tables and mortality improvement tables, which
are statistical tables of expected annual mortality rates and expected future mortality improvements, respectively. We utilize a
mortality table that best aligns with the underlying demographics and census data of the Plan participants. For the year ended
December 31, 2014, based on updates to the most relevant mortality assumptions that align to the demographics of the Plan
participants, life expectancies were shown to be longer, resulting in a pre-tax actuarial loss of $18 million included in "Accumulated
other comprehensive loss" and a corresponding increase to the projected benefit obligation as of December 31, 2014.