Western Union 2014 Annual Report Download - page 17
Download and view the complete annual report
Please find page 17 of the 2014 Western Union annual report below. You can navigate through the pages in the report by either clicking on the pages listed below, or by using the keyword search tool below to find specific information within the annual report.-
 1
1 -
2
-
3
-
4
-
5
-
6
-
 7
7 -
 8
8 -
 9
9 -
 10
10 -
 11
11 -
 12
12 -
 13
13 -
 14
14 -
 15
15 -
 16
16 -
 17
17 -
 18
18 -
 19
19 -
 20
20 -
 21
21 -
 22
22 -
 23
23 -
 24
24 -
 25
25 -
 26
26 -
 27
27 -
28
-
29
-
30
-
31
-
32
-
33
-
34
-
35
-
36
-
37
-
38
-
39
-
40
-
41
-
42
-
43
-
44
-
45
-
46
-
47
-
48
-
49
-
50
-
51
-
52
-
53
-
54
-
55
-
56
-
57
-
58
-
59
-
60
-
61
-
62
-
63
-
64
-
65
-
66
-
67
-
68
-
69
-
70
-
71
-
72
-
73
-
74
-
75
-
76
-
77
-
78
-
79
-
80
-
81
-
82
-
83
-
84
-
85
-
86
-
87
-
88
-
89
-
90
-
91
-
92
-
93
-
94
-
95
-
96
-
97
-
98
-
99
-
100
-
101
-
102
-
103
-
104
-
105
-
106
-
107
-
108
-
109
-
110
-
111
-
112
-
113
-
114
-
115
-
116
-
117
-
118
-
119
-
120
-
121
-
122
-
123
-
124
-
125
-
126
-
127
-
128
-
129
-
130
-
131
-
132
-
133
-
134
-
135
-
136
-
137
-
138
-
139
-
140
-
141
-
142
-
143
-
144
-
145
-
146
-
147
-
148
-
149
-
150
-
151
-
152
-
153
-
154
-
155
-
156
-
157
-
158
-
159
-
160
-
161
-
162
-
163
-
164
-
165
-
166
-
167
-
168
-
169
-
170
-
171
-
172
-
173
-
174
-
175
-
176
-
177
-
178
-
179
-
180
-
181
-
182
-
183
-
184
-
185
-
186
-
187
-
188
-
189
-
190
-
191
-
192
-
193
-
194
-
195
-
196
-
197
-
198
-
199
-
200
-
201
-
202
-
203
-
204
-
205
-
206
-
207
-
208
-
209
-
210
-
211
-
212
-
213
-
214
-
215
-
216
-
217
-
218
-
219
-
220
-
221
-
222
-
223
-
224
-
225
-
226
-
227
-
228
-
229
-
230
-
231
-
232
-
233
-
234
-
235
-
236
-
237
-
238
-
239
-
240
-
241
-
242
-
243
-
244
-
245
-
246
-
247
-
248
-
249
-
250
-
251
-
252
-
253
-
254
-
255
-
256
-
257
-
258
-
259
-
260
-
261
-
262
-
263
-
264
-
265
-
266
-
267
-
268
-
269
-
270
-
271
-
272
-
273
-
274
-
275
-
276
-
277
-
278
-
279
-
280
-
281
-
282
-
283
-
284
-
285
-
286
-
287
-
288
-
289
-
290
-
291
-
292
-
293
-
294
-
295
-
296
-
297
-
298
-
299
-
300
-
301
-
302
-
303
-
304
-
305
-
306
 |
 |

Proxy Summary PROXY STATEMENT
v | The Western Union Company – Proxy Statement
NOTICE OF 2015 ANNUAL MEETING OF STOCKHOLDERS AND PROXY STATEMENT
Chief Executive Officer Compensation
For 2014 performance, Mr. Ersek received a cash payout
under the 2014 Annual Incentive Plan of $1,314,800,
reflecting a blended payout of 88% of target based
on the Company’s achievement of corporate and
strategic performance goals, as compared to an 84%
of target payout for 2013 performance and no payout
for 2012 performance. The Compensation Committee
based Mr. Ersek’s award opportunity under the Annual
Incentive Plan on the achievement of corporate and
strategic performance goals and did not include individual
performance goals. As noted above, the 2014 Annual
Incentive Plan financial performance target objectives
were set higher than the constant currency financial
performance target objectives and actual results under the
2013 Annual Incentive Plan. Also for 2014, the committee
awarded Mr. Ersek a discretionary bonus of $115,000 in
recognition of his leadership in enhancing the Company’s
global compliance programs.
The following chart demonstrates that variable,
performance-based pay elements comprised approximately
88% of the targeted 2014 annual compensation for
Mr. Ersek (consisting of target payout opportunity
under the Annual Incentive Plan and stock option and
performance-based restricted stock unit components
under the Long-Term Incentive Plan). Pay is based on the
annual base salary and target incentive opportunities
applicable to Mr. Ersek as of December 31, 2014.
17%
12%
71%
Annual Incentive
Base Salary
Long-Term Equity Compensation
CHIEF EXECUTIVE OFFICER
2014 TOTAL DIRECT COMPENSATION
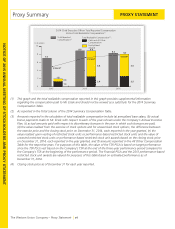
Since a significant portion of Mr. Ersek’s compensation is
both performance-based and “at-risk,” we are providing
the following supplemental graph to demonstrate
the difference between the compensation granted to
Mr. Ersek as required to be reported by the U.S. Securities
and Exchange Commission (the “SEC”) rules in the 2014
Summary Compensation Table, and the compensation
“realizable” by him for 2012 to 2014.
We believe the “realizable” compensation shown is
reflective of the Compensation Committee’s emphasis
on “pay-for-performance” in that differences between
realizable pay and total reported compensation as well
as fluctuations year-over-year are primarily the result of
our varying levels of achievement against pre-established
performance goals under our Annual Incentive Plan and
Long-Term Incentive Plan and our stock performance.
For example, as illustrated in the following table, 2012
realizable compensation was significantly below 2012
reported compensation and 2013 and 2014 realizable
compensation. This difference was primarily a result of a
2012 payout level of 13% of target for the Chief Executive
Officer for the Company’s 2012 performance-based
stock unit awards, no payout for the Chief Executive
Officer under the 2012 Annual Incentive Plan, and
stock price depreciation during 2012. In contrast, the
improvement in realizable compensation in 2013 and 2014
is primarily attributable to our estimated performance as
of December 31, 2014 against the financial performance
objectives under the Company’s 2013 and 2014
performance-based restricted stock unit awards and stock
price appreciation.