Western Union 2014 Annual Report Download - page 208
Download and view the complete annual report
Please find page 208 of the 2014 Western Union annual report below. You can navigate through the pages in the report by either clicking on the pages listed below, or by using the keyword search tool below to find specific information within the annual report.-
 1
1 -
2
-
3
-
4
-
5
-
6
-
7
-
8
-
9
-
10
-
11
-
12
-
13
-
14
-
15
-
16
-
17
-
18
-
19
-
20
-
21
-
22
-
23
-
24
-
25
-
26
-
27
-
28
-
29
-
30
-
31
-
32
-
33
-
34
-
35
-
36
-
37
-
38
-
39
-
40
-
41
-
42
-
43
-
44
-
45
-
46
-
47
-
48
-
49
-
50
-
51
-
52
-
53
-
54
-
55
-
56
-
57
-
58
-
59
-
60
-
61
-
62
-
63
-
64
-
65
-
66
-
67
-
68
-
69
-
70
-
71
-
72
-
73
-
74
-
75
-
76
-
77
-
78
-
79
-
80
-
81
-
82
-
83
-
84
-
85
-
86
-
87
-
88
-
89
-
90
-
91
-
92
-
93
-
94
-
95
-
96
-
97
-
98
-
99
-
100
-
101
-
102
-
103
-
104
-
105
-
106
-
107
-
108
-
109
-
110
-
111
-
112
-
113
-
114
-
115
-
116
-
117
-
118
-
119
-
120
-
121
-
122
-
123
-
124
-
125
-
126
-
127
-
128
-
129
-
130
-
131
-
132
-
133
-
134
-
135
-
136
-
137
-
138
-
139
-
140
-
141
-
142
-
143
-
144
-
145
-
146
-
147
-
148
-
149
-
150
-
151
-
152
-
153
-
154
-
155
-
156
-
157
-
158
-
159
-
160
-
161
-
162
-
163
-
164
-
165
-
166
-
167
-
168
-
169
-
170
-
171
-
172
-
173
-
174
-
175
-
176
-
177
-
178
-
179
-
180
-
181
-
182
-
183
-
184
-
185
-
186
-
187
-
188
-
189
-
190
-
191
-
192
-
193
-
194
-
195
-
196
-
197
-
 198
198 -
 199
199 -
 200
200 -
 201
201 -
 202
202 -
 203
203 -
 204
204 -
 205
205 -
 206
206 -
 207
207 -
 208
208 -
 209
209 -
 210
210 -
 211
211 -
 212
212 -
 213
213 -
 214
214 -
 215
215 -
 216
216 -
 217
217 -
 218
218 -
219
-
220
-
221
-
222
-
223
-
224
-
225
-
226
-
227
-
228
-
229
-
230
-
231
-
232
-
233
-
234
-
235
-
236
-
237
-
238
-
239
-
240
-
241
-
242
-
243
-
244
-
245
-
246
-
247
-
248
-
249
-
250
-
251
-
252
-
253
-
254
-
255
-
256
-
257
-
258
-
259
-
260
-
261
-
262
-
263
-
264
-
265
-
266
-
267
-
268
-
269
-
270
-
271
-
272
-
273
-
274
-
275
-
276
-
277
-
278
-
279
-
280
-
281
-
282
-
283
-
284
-
285
-
286
-
287
-
288
-
289
-
290
-
291
-
292
-
293
-
294
-
295
-
296
-
297
-
298
-
299
-
300
-
301
-
302
-
303
-
304
-
305
-
306
 |
 |

2014 FORM 10-K
70
2013 compared to 2012
For the year ended December 31, 2013 compared to the prior year, Business Solutions revenue grew due to increased spot
payments activity and increased customer hedging. We believe the increase in customer hedging activity for the year ended
December 31, 2013 was partially driven by the level of certain major currencies against the United States dollar. The strengthening
of the United States dollar compared to most other foreign currencies negatively impacted revenue growth by approximately 2%.
Additionally, the acquisition of the French assets of TGBP, which was completed in May 2012 after receiving regulatory approval,
contributed approximately 1% to the segment's revenue growth for the year ended December 31, 2013.
Operating loss
2014 compared to 2013
For the year ended December 31, 2014, the operating loss decreased compared to the prior year due to decreased TGBP
integration expenses and the revenue increases described above, partially offset by higher bank fees and increased compliance
program costs. The change in operating loss margins in the segment was due to these same factors.
2013 compared to 2012
For the year ended December 31, 2013, the operating loss decreased compared to the prior year due to increased revenue,
partially offset by increased strategic investments. Additionally, operating loss for the year ended December 31, 2013 was impacted
by decreased integration expenses. The change in operating loss margins in the segment was due to these same factors.
Other
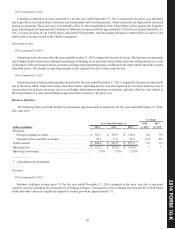
The following table sets forth Other results for the years ended December 31, 2014, 2013 and 2012.
% Change
Year Ended December 31, 2014 2013
(dollars in millions) 2014 2013 2012 vs. 2013 vs. 2012
Revenues. . . . . . . . . . . . . . . . . . . . . . . . . . . . . . . . . . . . . . . . . . . . $ 118.0 $ 107.0 $ 109.2 10% (2)%
Operating income/(loss) . . . . . . . . . . . . . . . . . . . . . . . . . . . . . . . . $ 3.5 $ (17.9) $ (19.7) * *
____________
* Calculation not meaningful.
Revenues
2014 compared to 2013
Other revenue increased for the year ended December 31, 2014 compared to the prior year primarily due to increases in our
retail walk-in foreign exchange services resulting from our acquisition of Fitta, and increased investment income in our money
order business, partially offset by declines in our prepaid services.
2013 compared to 2012
Other revenue decreased for the year ended December 31, 2013 compared to the prior year primarily due to declines in our
prepaid services.