Western Union 2014 Annual Report Download - page 203
Download and view the complete annual report
Please find page 203 of the 2014 Western Union annual report below. You can navigate through the pages in the report by either clicking on the pages listed below, or by using the keyword search tool below to find specific information within the annual report.-
 1
1 -
2
-
3
-
4
-
5
-
6
-
7
-
8
-
9
-
10
-
11
-
12
-
13
-
14
-
15
-
16
-
17
-
18
-
19
-
20
-
21
-
22
-
23
-
24
-
25
-
26
-
27
-
28
-
29
-
30
-
31
-
32
-
33
-
34
-
35
-
36
-
37
-
38
-
39
-
40
-
41
-
42
-
43
-
44
-
45
-
46
-
47
-
48
-
49
-
50
-
51
-
52
-
53
-
54
-
55
-
56
-
57
-
58
-
59
-
60
-
61
-
62
-
63
-
64
-
65
-
66
-
67
-
68
-
69
-
70
-
71
-
72
-
73
-
74
-
75
-
76
-
77
-
78
-
79
-
80
-
81
-
82
-
83
-
84
-
85
-
86
-
87
-
88
-
89
-
90
-
91
-
92
-
93
-
94
-
95
-
96
-
97
-
98
-
99
-
100
-
101
-
102
-
103
-
104
-
105
-
106
-
107
-
108
-
109
-
110
-
111
-
112
-
113
-
114
-
115
-
116
-
117
-
118
-
119
-
120
-
121
-
122
-
123
-
124
-
125
-
126
-
127
-
128
-
129
-
130
-
131
-
132
-
133
-
134
-
135
-
136
-
137
-
138
-
139
-
140
-
141
-
142
-
143
-
144
-
145
-
146
-
147
-
148
-
149
-
150
-
151
-
152
-
153
-
154
-
155
-
156
-
157
-
158
-
159
-
160
-
161
-
162
-
163
-
164
-
165
-
166
-
167
-
168
-
169
-
170
-
171
-
172
-
173
-
174
-
175
-
176
-
177
-
178
-
179
-
180
-
181
-
182
-
183
-
184
-
185
-
186
-
187
-
188
-
189
-
190
-
191
-
192
-
 193
193 -
 194
194 -
 195
195 -
 196
196 -
 197
197 -
 198
198 -
 199
199 -
 200
200 -
 201
201 -
 202
202 -
 203
203 -
 204
204 -
 205
205 -
 206
206 -
 207
207 -
 208
208 -
 209
209 -
 210
210 -
 211
211 -
 212
212 -
 213
213 -
214
-
215
-
216
-
217
-
218
-
219
-
220
-
221
-
222
-
223
-
224
-
225
-
226
-
227
-
228
-
229
-
230
-
231
-
232
-
233
-
234
-
235
-
236
-
237
-
238
-
239
-
240
-
241
-
242
-
243
-
244
-
245
-
246
-
247
-
248
-
249
-
250
-
251
-
252
-
253
-
254
-
255
-
256
-
257
-
258
-
259
-
260
-
261
-
262
-
263
-
264
-
265
-
266
-
267
-
268
-
269
-
270
-
271
-
272
-
273
-
274
-
275
-
276
-
277
-
278
-
279
-
280
-
281
-
282
-
283
-
284
-
285
-
286
-
287
-
288
-
289
-
290
-
291
-
292
-
293
-
294
-
295
-
296
-
297
-
298
-
299
-
300
-
301
-
302
-
303
-
304
-
305
-
306
 |
 |

2014 FORM 10-K
65
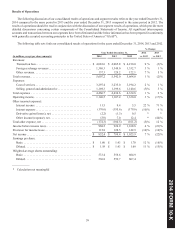
Due to the significance of our Consumer-to-Consumer segment to our overall results and the effect that foreign exchange
fluctuations against the United States dollar can have on our reported revenues, constant currency results have been provided in
the tables below. Constant currency is a non-GAAP financial measure and is provided so that revenue can be viewed without the
effect of fluctuations in foreign currency exchange rates, which is consistent with how management evaluates our revenue results
and trends. This constant currency disclosure is provided in addition to, and not as a substitute for, the year-over-year percentage
change in revenue on a GAAP basis. Other companies may calculate and define similarly labeled items differently, which may
limit the usefulness of this measure for comparative purposes.
Year Ended December 31,
Reported Growth Foreign Exchange
Translation Impact Constant Currency
Growth (a)
2014 2013 2014 2013 2014 2013
Consumer-to-Consumer revenue growth/(decline):
Europe and CIS . . . . . . . . . . . . . . . . . . . . . . . . . . . . . . . 0 % (4)% (1)% 0 % 1% (4)%
North America . . . . . . . . . . . . . . . . . . . . . . . . . . . . . . . . 1 % (9)% 0 % 0 % 1% (9)%
Middle East and Africa . . . . . . . . . . . . . . . . . . . . . . . . . 2 % 0 % (1)% 0 % 3% 0 %
Asia Pacific ("APAC"). . . . . . . . . . . . . . . . . . . . . . . . . . 0 % (3)% (2)% (1)% 2% (2)%
Latin America and the Caribbean ("LACA") (b). . . . . . (6)% (3)% (8)% (6)% 2% 3 %
westernunion.com . . . . . . . . . . . . . . . . . . . . . . . . . . . . . 28 % 24 % (1)% (1)% 29% 25 %
Total Consumer-to-Consumer revenue growth/(decline): 1 % (3)% (2)% 0 % 3% (3)%
Year Ended December 31,
2014 2013
Consumer-to-Consumer transaction growth/(decline):
Europe and CIS. . . . . . . . . . . . . . . . . . . . . . . . . . . . . . . . . . . . . . . . . . . . . . . . . . . . . . . . . . . . . . . . 9% 4 %
North America . . . . . . . . . . . . . . . . . . . . . . . . . . . . . . . . . . . . . . . . . . . . . . . . . . . . . . . . . . . . . . . . 3% 0 %
Middle East and Africa. . . . . . . . . . . . . . . . . . . . . . . . . . . . . . . . . . . . . . . . . . . . . . . . . . . . . . . . . . 3% 7 %
APAC . . . . . . . . . . . . . . . . . . . . . . . . . . . . . . . . . . . . . . . . . . . . . . . . . . . . . . . . . . . . . . . . . . . . . . . 1% 6 %
LACA . . . . . . . . . . . . . . . . . . . . . . . . . . . . . . . . . . . . . . . . . . . . . . . . . . . . . . . . . . . . . . . . . . . . . . . 3% (1)%
westernunion.com. . . . . . . . . . . . . . . . . . . . . . . . . . . . . . . . . . . . . . . . . . . . . . . . . . . . . . . . . . . . . . 39% 65 %
Consumer-to-Consumer revenue as a percentage of consolidated revenue:
Europe and CIS. . . . . . . . . . . . . . . . . . . . . . . . . . . . . . . . . . . . . . . . . . . . . . . . . . . . . . . . . . . . . . . . 21% 21 %
North America . . . . . . . . . . . . . . . . . . . . . . . . . . . . . . . . . . . . . . . . . . . . . . . . . . . . . . . . . . . . . . . . 19% 19 %
Middle East and Africa. . . . . . . . . . . . . . . . . . . . . . . . . . . . . . . . . . . . . . . . . . . . . . . . . . . . . . . . . . 16% 16 %
APAC . . . . . . . . . . . . . . . . . . . . . . . . . . . . . . . . . . . . . . . . . . . . . . . . . . . . . . . . . . . . . . . . . . . . . . . 12% 12 %
LACA . . . . . . . . . . . . . . . . . . . . . . . . . . . . . . . . . . . . . . . . . . . . . . . . . . . . . . . . . . . . . . . . . . . . . . . 8% 9 %
westernunion.com. . . . . . . . . . . . . . . . . . . . . . . . . . . . . . . . . . . . . . . . . . . . . . . . . . . . . . . . . . . . . . 4% 3 %
____________
(a) Constant currency revenue growth assumes that revenues denominated in foreign currencies are translated to the U.S.
dollar, net of the effect of foreign currency hedges, at rates consistent with those in the prior year.
(b) For the years ended December 31, 2014 and December 31, 2013 compared to the prior year, the foreign exchange translation
impact is primarily the result of fluctuations in the exchange rate between the United States dollar and the Argentine peso
and other South American currencies.
We provide domestic money transfer services (transactions between and within the United States and Canada), which are
included in North America and westernunion.com in the tables above. These services represented approximately 8% of our
consolidated revenue for each of the years ended December 31, 2014, 2013, and 2012.