Western Union 2014 Annual Report Download - page 16
Download and view the complete annual report
Please find page 16 of the 2014 Western Union annual report below. You can navigate through the pages in the report by either clicking on the pages listed below, or by using the keyword search tool below to find specific information within the annual report.-
 1
1 -
2
-
3
-
4
-
5
-
 6
6 -
 7
7 -
 8
8 -
 9
9 -
 10
10 -
 11
11 -
 12
12 -
 13
13 -
 14
14 -
 15
15 -
 16
16 -
 17
17 -
 18
18 -
 19
19 -
 20
20 -
 21
21 -
 22
22 -
 23
23 -
 24
24 -
 25
25 -
 26
26 -
27
-
28
-
29
-
30
-
31
-
32
-
33
-
34
-
35
-
36
-
37
-
38
-
39
-
40
-
41
-
42
-
43
-
44
-
45
-
46
-
47
-
48
-
49
-
50
-
51
-
52
-
53
-
54
-
55
-
56
-
57
-
58
-
59
-
60
-
61
-
62
-
63
-
64
-
65
-
66
-
67
-
68
-
69
-
70
-
71
-
72
-
73
-
74
-
75
-
76
-
77
-
78
-
79
-
80
-
81
-
82
-
83
-
84
-
85
-
86
-
87
-
88
-
89
-
90
-
91
-
92
-
93
-
94
-
95
-
96
-
97
-
98
-
99
-
100
-
101
-
102
-
103
-
104
-
105
-
106
-
107
-
108
-
109
-
110
-
111
-
112
-
113
-
114
-
115
-
116
-
117
-
118
-
119
-
120
-
121
-
122
-
123
-
124
-
125
-
126
-
127
-
128
-
129
-
130
-
131
-
132
-
133
-
134
-
135
-
136
-
137
-
138
-
139
-
140
-
141
-
142
-
143
-
144
-
145
-
146
-
147
-
148
-
149
-
150
-
151
-
152
-
153
-
154
-
155
-
156
-
157
-
158
-
159
-
160
-
161
-
162
-
163
-
164
-
165
-
166
-
167
-
168
-
169
-
170
-
171
-
172
-
173
-
174
-
175
-
176
-
177
-
178
-
179
-
180
-
181
-
182
-
183
-
184
-
185
-
186
-
187
-
188
-
189
-
190
-
191
-
192
-
193
-
194
-
195
-
196
-
197
-
198
-
199
-
200
-
201
-
202
-
203
-
204
-
205
-
206
-
207
-
208
-
209
-
210
-
211
-
212
-
213
-
214
-
215
-
216
-
217
-
218
-
219
-
220
-
221
-
222
-
223
-
224
-
225
-
226
-
227
-
228
-
229
-
230
-
231
-
232
-
233
-
234
-
235
-
236
-
237
-
238
-
239
-
240
-
241
-
242
-
243
-
244
-
245
-
246
-
247
-
248
-
249
-
250
-
251
-
252
-
253
-
254
-
255
-
256
-
257
-
258
-
259
-
260
-
261
-
262
-
263
-
264
-
265
-
266
-
267
-
268
-
269
-
270
-
271
-
272
-
273
-
274
-
275
-
276
-
277
-
278
-
279
-
280
-
281
-
282
-
283
-
284
-
285
-
286
-
287
-
288
-
289
-
290
-
291
-
292
-
293
-
294
-
295
-
296
-
297
-
298
-
299
-
300
-
301
-
302
-
303
-
304
-
305
-
306
 |
 |

The Western Union Company – Proxy Statement | iv
Proxy Summary PROXY STATEMENT
NOTICE OF 2015 ANNUAL MEETING OF STOCKHOLDERS AND PROXY STATEMENT
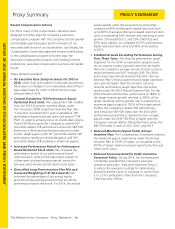
Recent Compensation Actions
For 2014, many of the compensation decisions were
designed to further align the Company’s executive
compensation program with the Company’s future growth
and strategic operating plans and the interests of our
executives with those of our stockholders. Specifically, the
Compensation Committee approved several modifications
to the compensation program to further align the
executive compensation program with evolving investor
preferences, executive compensation practices and market
trends.
These decisions included:
• No Executive Base Salary Increases for 2013 or
2014: Other than with respect to executive promotions,
there were no changes in our named executive officers’
base salary levels for 2013 or 2014 from the levels
effective March 2012.
• Created Standalone TSR Performance-Based
Restricted Stock Units: We replaced the TSR modifier
from our 2013 long-term incentive design under
the Company’s 2006 Long-Term Incentive Plan (the
“Long-Term Incentive Plan”) with a standalone TSR
performance-based restricted stock unit award (“TSR
PSU”) in order to enhance focus on stockholder returns.
These TSR PSUs require the Company to achieve 60th
percentile relative TSR performance versus the S&P 500
Index over a three-year performance period in order
to earn target payout, with 30th percentile relative TSR
performance resulting in threshold payout and 90th
percentile relative TSR resulting in maximum payout.
• Increased Performance Period for Performance-
Based Restricted Stock Units: We increased the
performance period of our performance-based
restricted stock units so that they will be subject to
a three-year total performance period, versus the
two-year performance period used in prior years.
• Diversified Long-Term Incentive Plan Mix and
Increased Weighting of At-Risk Awards: We
increased the percentage of our annual equity
grants that have vesting provisions that are strictly
performance-based and at-risk. For 2014, the annual
equity awards under the Long-Term Incentive Plan
consisted of 80% performance-based restricted stock
units (60% financial performance-based restricted stock
units, incorporating both revenue and operating income
growth (“Financial PSUs”), and 20% TSR PSUs) and
20% stock options, as compared to 67% performance-
based restricted stock units and 33% stock options
in 2013.
• Established Goals Exceeding Performance During
Prior Three Years: The financial performance target
objectives for the 2014 compensation program were
set at constant currency growth rates that are higher
than the Company’s average annual constant currency
results achieved over 2011 through 2013. The 2014
Senior Executive Annual Incentive Plan (the “Annual
Incentive Plan”) financial performance target objectives
were also set higher than the constant currency
financial performance target objectives and actual
results under the 2013 Annual Incentive Plan. For the
2014 Annual Incentive Plan, performance at 184% of
the target revenue growth rate and at 200% of the
target operating income growth rate is required for a
maximum payout equal to 150% of the target award.
Further, the Company’s relative TSR performance
rank versus the S&P 500 Index over the 2014-2016
performance period that is required to earn a target
payout under the 2014 TSR PSUs is higher than the
Company’s annual relative TSR performance versus the
S&P 500 Index in each of 2011, 2012, and 2013.
• Reduced Maximum Payout Under Annual
Incentive Plan: The Compensation Committee reduced
the maximum payout opportunity under the Annual
Incentive Plan to 150% of target, as compared to the
200% of target maximum payout opportunity that was
used in prior years.
• Reduced Severance Benefits Under Executive
Severance Policy: During 2014, the Compensation
Committee amended the Company’s executive
severance policy (the “Executive Severance Policy”)
to reduce the severance multiple for determining
severance benefits prior to a change-in-control from
2 to 1.5 for participants other than the Company’s
Chief Executive Officer.