Western Union 2014 Annual Report Download - page 273
Download and view the complete annual report
Please find page 273 of the 2014 Western Union annual report below. You can navigate through the pages in the report by either clicking on the pages listed below, or by using the keyword search tool below to find specific information within the annual report.-
 1
1 -
2
-
3
-
4
-
5
-
6
-
7
-
8
-
9
-
10
-
11
-
12
-
13
-
14
-
15
-
16
-
17
-
18
-
19
-
20
-
21
-
22
-
23
-
24
-
25
-
26
-
27
-
28
-
29
-
30
-
31
-
32
-
33
-
34
-
35
-
36
-
37
-
38
-
39
-
40
-
41
-
42
-
43
-
44
-
45
-
46
-
47
-
48
-
49
-
50
-
51
-
52
-
53
-
54
-
55
-
56
-
57
-
58
-
59
-
60
-
61
-
62
-
63
-
64
-
65
-
66
-
67
-
68
-
69
-
70
-
71
-
72
-
73
-
74
-
75
-
76
-
77
-
78
-
79
-
80
-
81
-
82
-
83
-
84
-
85
-
86
-
87
-
88
-
89
-
90
-
91
-
92
-
93
-
94
-
95
-
96
-
97
-
98
-
99
-
100
-
101
-
102
-
103
-
104
-
105
-
106
-
107
-
108
-
109
-
110
-
111
-
112
-
113
-
114
-
115
-
116
-
117
-
118
-
119
-
120
-
121
-
122
-
123
-
124
-
125
-
126
-
127
-
128
-
129
-
130
-
131
-
132
-
133
-
134
-
135
-
136
-
137
-
138
-
139
-
140
-
141
-
142
-
143
-
144
-
145
-
146
-
147
-
148
-
149
-
150
-
151
-
152
-
153
-
154
-
155
-
156
-
157
-
158
-
159
-
160
-
161
-
162
-
163
-
164
-
165
-
166
-
167
-
168
-
169
-
170
-
171
-
172
-
173
-
174
-
175
-
176
-
177
-
178
-
179
-
180
-
181
-
182
-
183
-
184
-
185
-
186
-
187
-
188
-
189
-
190
-
191
-
192
-
193
-
194
-
195
-
196
-
197
-
198
-
199
-
200
-
201
-
202
-
203
-
204
-
205
-
206
-
207
-
208
-
209
-
210
-
211
-
212
-
213
-
214
-
215
-
216
-
217
-
218
-
219
-
220
-
221
-
222
-
223
-
224
-
225
-
226
-
227
-
228
-
229
-
230
-
231
-
232
-
233
-
234
-
235
-
236
-
237
-
238
-
239
-
240
-
241
-
242
-
243
-
244
-
245
-
246
-
247
-
248
-
249
-
250
-
251
-
252
-
253
-
254
-
255
-
256
-
257
-
258
-
259
-
260
-
261
-
262
-
 263
263 -
 264
264 -
 265
265 -
 266
266 -
 267
267 -
 268
268 -
 269
269 -
 270
270 -
 271
271 -
 272
272 -
 273
273 -
 274
274 -
 275
275 -
 276
276 -
 277
277 -
 278
278 -
 279
279 -
 280
280 -
 281
281 -
 282
282 -
 283
283 -
284
-
285
-
286
-
287
-
288
-
289
-
290
-
291
-
292
-
293
-
294
-
295
-
296
-
297
-
298
-
299
-
300
-
301
-
302
-
303
-
304
-
305
-
306
 |
 |

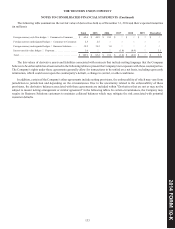
2014 FORM 10-K
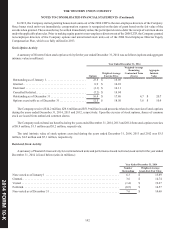
THE WESTERN UNION COMPANY
NOTES TO CONSOLIDATED FINANCIAL STATEMENTS (Continued)
135
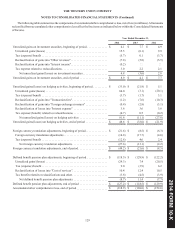
Income Statement
The following tables summarize the location and amount of gains and losses of derivatives in the Consolidated Statements of
Income segregated by designated, qualifying hedging instruments and those that are not, for the years ended December 31, 2014,
2013 and 2012 (in millions):
Fair Value Hedges
The following table presents the location and amount of gains/(losses) from fair value hedges for the years ended December 31,
2014, 2013 and 2012 (in millions):
Gain/(Loss) Recognized in Income on
Derivatives Gain/(Loss) Recognized in Income on
Related Hedged Item (a)
Gain/(Loss) Recognized in Income on
Derivatives (Ineffective Portion and Amount
Excluded from Effectiveness Testing)
Income
Statement
Location
Amount Income
Statement
Location
Amount Income
Statement
Location
Amount
Derivatives 2014 2013 2012 Hedged
Item 2014 2013 2012 2014 2013 2012
Interest rate
contracts .Interest
expense .$ 17.5 $ (8.5) $ 3.9 Fixed-
rate debt.Interest
expense .$(4.4) $ 19.3 $ 3.7 Interest
expense .$(0.7) $ — $ —
Total gain/
(loss). . . . . . $ 17.5 $ (8.5) $ 3.9 $ (4.4) $ 19.3 $ 3.7 $ (0.7) $ — $ —
Cash Flow Hedges
The following table presents the location and amount of gains/(losses) from cash flow hedges for the years ended December 31,
2014, 2013 and 2012 (in millions):
Gain/(Loss) Recognized Gain/(Loss) Reclassified Gain/(Loss) Recognized in Income on
in OCI on Derivatives from Accumulated OCI into Income Derivatives (Ineffective Portion and Amount
(Effective Portion) (Effective Portion) Excluded from Effectiveness Testing) (b)
Amount Income
Statement
Location
Amount Income
Statement
Location
Amount
Derivatives 2014 2013 2012 2014 2013 2012 2014 2013 2012
Foreign currency
contracts. . . . . $ 84.0 $ (3.1) $ (20.1) Revenue $ 1.6 $ 10.4 $ 13.4 Derivative
gains/(losses), net $ (4.4) $ (0.4) $ (0.1)
Interest rate
contracts (c). . — — — Interest expense (3.6) (3.6) (3.6) Interest expense — — —
Total gain/(loss) . $ 84.0 $ (3.1) $ (20.1) $ (2.0) $ 6.8 $ 9.8 $ (4.4) $ (0.4) $ (0.1)