Western Union 2014 Annual Report Download - page 194
Download and view the complete annual report
Please find page 194 of the 2014 Western Union annual report below. You can navigate through the pages in the report by either clicking on the pages listed below, or by using the keyword search tool below to find specific information within the annual report.-
 1
1 -
2
-
3
-
4
-
5
-
6
-
7
-
8
-
9
-
10
-
11
-
12
-
13
-
14
-
15
-
16
-
17
-
18
-
19
-
20
-
21
-
22
-
23
-
24
-
25
-
26
-
27
-
28
-
29
-
30
-
31
-
32
-
33
-
34
-
35
-
36
-
37
-
38
-
39
-
40
-
41
-
42
-
43
-
44
-
45
-
46
-
47
-
48
-
49
-
50
-
51
-
52
-
53
-
54
-
55
-
56
-
57
-
58
-
59
-
60
-
61
-
62
-
63
-
64
-
65
-
66
-
67
-
68
-
69
-
70
-
71
-
72
-
73
-
74
-
75
-
76
-
77
-
78
-
79
-
80
-
81
-
82
-
83
-
84
-
85
-
86
-
87
-
88
-
89
-
90
-
91
-
92
-
93
-
94
-
95
-
96
-
97
-
98
-
99
-
100
-
101
-
102
-
103
-
104
-
105
-
106
-
107
-
108
-
109
-
110
-
111
-
112
-
113
-
114
-
115
-
116
-
117
-
118
-
119
-
120
-
121
-
122
-
123
-
124
-
125
-
126
-
127
-
128
-
129
-
130
-
131
-
132
-
133
-
134
-
135
-
136
-
137
-
138
-
139
-
140
-
141
-
142
-
143
-
144
-
145
-
146
-
147
-
148
-
149
-
150
-
151
-
152
-
153
-
154
-
155
-
156
-
157
-
158
-
159
-
160
-
161
-
162
-
163
-
164
-
165
-
166
-
167
-
168
-
169
-
170
-
171
-
172
-
173
-
174
-
175
-
176
-
177
-
178
-
179
-
180
-
181
-
182
-
183
-
 184
184 -
 185
185 -
 186
186 -
 187
187 -
 188
188 -
 189
189 -
 190
190 -
 191
191 -
 192
192 -
 193
193 -
 194
194 -
 195
195 -
 196
196 -
 197
197 -
 198
198 -
 199
199 -
 200
200 -
 201
201 -
 202
202 -
 203
203 -
 204
204 -
205
-
206
-
207
-
208
-
209
-
210
-
211
-
212
-
213
-
214
-
215
-
216
-
217
-
218
-
219
-
220
-
221
-
222
-
223
-
224
-
225
-
226
-
227
-
228
-
229
-
230
-
231
-
232
-
233
-
234
-
235
-
236
-
237
-
238
-
239
-
240
-
241
-
242
-
243
-
244
-
245
-
246
-
247
-
248
-
249
-
250
-
251
-
252
-
253
-
254
-
255
-
256
-
257
-
258
-
259
-
260
-
261
-
262
-
263
-
264
-
265
-
266
-
267
-
268
-
269
-
270
-
271
-
272
-
273
-
274
-
275
-
276
-
277
-
278
-
279
-
280
-
281
-
282
-
283
-
284
-
285
-
286
-
287
-
288
-
289
-
290
-
291
-
292
-
293
-
294
-
295
-
296
-
297
-
298
-
299
-
300
-
301
-
302
-
303
-
304
-
305
-
306
 |
 |

2014 FORM 10-K
56
(a) Revenue for the years ended December 31, 2012 and 2011 included $238.5 million and $35.2 million, respectively, of
revenue related to Travelex Global Business Payments ("TGBP"), which was acquired in November 2011. TGBP and
Custom House Ltd., which was acquired in September 2009, have subsequently been rebranded to "Western Union Business
Solutions."
(b) Operating expenses for the years ended December 31, 2011 and 2010 included $46.8 million and $59.5 million of
restructuring and related expenses, respectively, associated with a restructuring plan designed to reduce overall headcount
and migrate positions from various facilities, primarily within the United States and Europe, to regional operating centers.
(c) Interest income consists of interest earned on cash balances not required to satisfy settlement obligations.
(d) Interest expense primarily relates to our outstanding borrowings.
(e) In 2011, we recognized gains of $20.5 million and $29.4 million, in connection with the remeasurement of our former
equity interests in Finint S.r.l. and Angelo Costa S.r.l., respectively, to fair value. These equity interests were remeasured
in conjunction with our purchases of the remaining interests in these entities that we previously did not hold. Additionally,
in 2011, we recognized a $20.8 million net gain on foreign currency forward contracts entered into in order to reduce the
economic variability related to the cash amounts used to fund acquisitions of businesses with purchase prices denominated
in foreign currencies, primarily for the TGBP acquisition.
(f) In December 2011, we reached an agreement with the United States Internal Revenue Service ("IRS Agreement") resolving
substantially all of the issues related to the restructuring of our international operations in 2003. As a result of the IRS
Agreement, we recognized a tax benefit of $204.7 million related to the adjustment of reserves associated with this matter.
(g) Net cash provided by operating activities during the year ended December 31, 2012 was impacted by tax payments of
$92.4 million made as a result of the IRS Agreement. Net cash provided by operating activities for the year ended
December 31, 2010 was impacted by a $250 million tax deposit made relating to United States federal tax liabilities,
including those arising from our 2003 international restructuring, which were previously accrued in our consolidated
financial statements. Also impacting net cash provided by operating activities during the year ended December 31, 2010
were cash payments of $71.0 million related to the settlement agreement with the State of Arizona and other states.
(h) Capital expenditures include capitalization of contract costs, capitalization of purchased and developed software and
purchases of property and equipment.
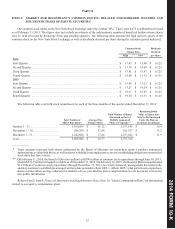
(i) On February 11, 2014, the Board of Directors authorized $500 million of common stock repurchases through June 30,
2015, of which $11.9 million remains available as of December 31, 2014. On February 10, 2015, the Board of Directors
authorized $1.2 billion of common stock repurchases through December 31, 2017. During the years ended December 31,
2014, 2013, 2012, 2011 and 2010, we repurchased 29.3 million, 25.7 million, 51.0 million, 40.3 million and 35.6 million
shares, respectively.
(j) Cash dividends per share declared quarterly by the Company's Board of Directors were as follows:
Year Q1 Q2 Q3 Q4
2014. . . . . . . . . . . . . . . . . . . . . . . . . . . . . . . . . . . . . . . . . . . . . . . $ 0.125 $ 0.125 $ 0.125 $ 0.125
2013. . . . . . . . . . . . . . . . . . . . . . . . . . . . . . . . . . . . . . . . . . . . . . . $ 0.125 $ 0.125 $ 0.125 $ 0.125
2012. . . . . . . . . . . . . . . . . . . . . . . . . . . . . . . . . . . . . . . . . . . . . . . $ 0.10 $ 0.10 $ 0.10 $ 0.125
2011. . . . . . . . . . . . . . . . . . . . . . . . . . . . . . . . . . . . . . . . . . . . . . . $ 0.07 $ 0.08 $ 0.08 $ 0.08
2010. . . . . . . . . . . . . . . . . . . . . . . . . . . . . . . . . . . . . . . . . . . . . . . $ 0.06 $ 0.06 $ 0.06 $ 0.07
(k) Consumer-to-Consumer transactions include Western Union, Vigo and Orlandi Valuta branded Consumer-to-Consumer
money transfer services worldwide.