Western Union 2014 Annual Report Download - page 204
Download and view the complete annual report
Please find page 204 of the 2014 Western Union annual report below. You can navigate through the pages in the report by either clicking on the pages listed below, or by using the keyword search tool below to find specific information within the annual report.-
 1
1 -
2
-
3
-
4
-
5
-
6
-
7
-
8
-
9
-
10
-
11
-
12
-
13
-
14
-
15
-
16
-
17
-
18
-
19
-
20
-
21
-
22
-
23
-
24
-
25
-
26
-
27
-
28
-
29
-
30
-
31
-
32
-
33
-
34
-
35
-
36
-
37
-
38
-
39
-
40
-
41
-
42
-
43
-
44
-
45
-
46
-
47
-
48
-
49
-
50
-
51
-
52
-
53
-
54
-
55
-
56
-
57
-
58
-
59
-
60
-
61
-
62
-
63
-
64
-
65
-
66
-
67
-
68
-
69
-
70
-
71
-
72
-
73
-
74
-
75
-
76
-
77
-
78
-
79
-
80
-
81
-
82
-
83
-
84
-
85
-
86
-
87
-
88
-
89
-
90
-
91
-
92
-
93
-
94
-
95
-
96
-
97
-
98
-
99
-
100
-
101
-
102
-
103
-
104
-
105
-
106
-
107
-
108
-
109
-
110
-
111
-
112
-
113
-
114
-
115
-
116
-
117
-
118
-
119
-
120
-
121
-
122
-
123
-
124
-
125
-
126
-
127
-
128
-
129
-
130
-
131
-
132
-
133
-
134
-
135
-
136
-
137
-
138
-
139
-
140
-
141
-
142
-
143
-
144
-
145
-
146
-
147
-
148
-
149
-
150
-
151
-
152
-
153
-
154
-
155
-
156
-
157
-
158
-
159
-
160
-
161
-
162
-
163
-
164
-
165
-
166
-
167
-
168
-
169
-
170
-
171
-
172
-
173
-
174
-
175
-
176
-
177
-
178
-
179
-
180
-
181
-
182
-
183
-
184
-
185
-
186
-
187
-
188
-
189
-
190
-
191
-
192
-
193
-
 194
194 -
 195
195 -
 196
196 -
 197
197 -
 198
198 -
 199
199 -
 200
200 -
 201
201 -
 202
202 -
 203
203 -
 204
204 -
 205
205 -
 206
206 -
 207
207 -
 208
208 -
 209
209 -
 210
210 -
 211
211 -
 212
212 -
 213
213 -
 214
214 -
215
-
216
-
217
-
218
-
219
-
220
-
221
-
222
-
223
-
224
-
225
-
226
-
227
-
228
-
229
-
230
-
231
-
232
-
233
-
234
-
235
-
236
-
237
-
238
-
239
-
240
-
241
-
242
-
243
-
244
-
245
-
246
-
247
-
248
-
249
-
250
-
251
-
252
-
253
-
254
-
255
-
256
-
257
-
258
-
259
-
260
-
261
-
262
-
263
-
264
-
265
-
266
-
267
-
268
-
269
-
270
-
271
-
272
-
273
-
274
-
275
-
276
-
277
-
278
-
279
-
280
-
281
-
282
-
283
-
284
-
285
-
286
-
287
-
288
-
289
-
290
-
291
-
292
-
293
-
294
-
295
-
296
-
297
-
298
-
299
-
300
-
301
-
302
-
303
-
304
-
305
-
306
 |
 |

2014 FORM 10-K
66
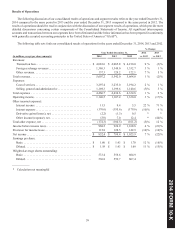
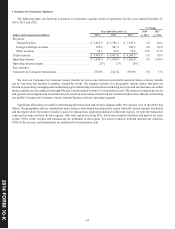
Our consumers transferred $85.4 billion, $82.0 billion, and $79.3 billion in Consumer-to-Consumer principal for the years
ended December 31, 2014, 2013 and 2012, respectively, of which $77.2 billion, $73.9 billion, and $71.3 billion related to cross-
border principal, for the same corresponding periods described above.
Transaction fees and foreign exchange revenues
2014 compared to 2013
For the year ended December 31, 2014 compared to the prior year, Consumer-to-Consumer money transfer revenue increased
1%, driven by strong results in westernunion.com. Revenue increased primarily due to transaction growth of 5%, partially offset
by price reductions and geographic and product mix. For the year ended December 31, 2014, fluctuations in the exchange rate
between the United States dollar and other currencies, net of the impact of foreign currency hedges, negatively impacted revenue
by 2%.
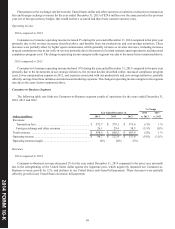
Our Europe and CIS region experienced flat revenue on transaction growth of 9% for the year ended December 31, 2014
compared to the prior year. Revenue was negatively impacted by geographic and product mix and price reductions. Russia
experienced strong transaction growth for most of the year but such growth moderated significantly toward the end of 2014; Russia
typically generates lower revenue per transaction than the average in this region.
Our North America region experienced revenue growth of 1%, on transaction growth of 3% for the year ended December 31,
2014 compared to the prior year. The increase in revenue primarily resulted from transaction growth in our United States outbound
and Mexico corridors and was offset by declines in our domestic money transfer services. Our domestic money transfer services
in the United States were negatively impacted by declines in higher principal band transactions, which generate higher revenue
per transaction, primarily due to competitive prices in the retail money transfer market. We expect these competitive prices will
continue to affect our domestic money transfer services in 2015.
Our Middle East and Africa region experienced revenue growth of 2%, on transaction growth of 3% for the year ended
December 31, 2014 compared to the prior year. This increase was primarily driven by growth in the United Arab Emirates and
Saudi Arabia, partially offset by declines in several African countries, including Libya.
Our APAC region experienced flat revenue on transaction growth of 1% for the year ended December 31, 2014 compared to
the prior year. The differential between the revenue and transaction change was primarily due to fluctuations in the exchange rate
between the United States dollar and other foreign currencies in the region, net of the impact of foreign currency hedges, partially
offset by geographic and product mix.
Our LACA region experienced decreased revenue of 6%, and transaction growth of 3% for the year ended December 31, 2014
compared to the prior year. Revenue was negatively impacted by fluctuations in the exchange rate between the United States dollar
and the Argentine peso and other foreign currencies in the region and by government imposed restrictions on the market in Venezuela.
Westernunion.com experienced revenue growth of 28% for the year ended December 31, 2014 compared to the prior year,
on transaction growth of 39%.
Foreign exchange revenues increased 2% for the year ended December 31, 2014 compared to the previous year, primarily
due to a 5% increase in cross-border principal.
Fluctuations in the exchange rate between the United States dollar and other currencies, net of the impact of foreign currency
hedges, have resulted in a reduction to revenues for the year ended December 31, 2014 of $80.7 million over the previous year.