Western Union 2014 Annual Report Download - page 262
Download and view the complete annual report
Please find page 262 of the 2014 Western Union annual report below. You can navigate through the pages in the report by either clicking on the pages listed below, or by using the keyword search tool below to find specific information within the annual report.-
 1
1 -
2
-
3
-
4
-
5
-
6
-
7
-
8
-
9
-
10
-
11
-
12
-
13
-
14
-
15
-
16
-
17
-
18
-
19
-
20
-
21
-
22
-
23
-
24
-
25
-
26
-
27
-
28
-
29
-
30
-
31
-
32
-
33
-
34
-
35
-
36
-
37
-
38
-
39
-
40
-
41
-
42
-
43
-
44
-
45
-
46
-
47
-
48
-
49
-
50
-
51
-
52
-
53
-
54
-
55
-
56
-
57
-
58
-
59
-
60
-
61
-
62
-
63
-
64
-
65
-
66
-
67
-
68
-
69
-
70
-
71
-
72
-
73
-
74
-
75
-
76
-
77
-
78
-
79
-
80
-
81
-
82
-
83
-
84
-
85
-
86
-
87
-
88
-
89
-
90
-
91
-
92
-
93
-
94
-
95
-
96
-
97
-
98
-
99
-
100
-
101
-
102
-
103
-
104
-
105
-
106
-
107
-
108
-
109
-
110
-
111
-
112
-
113
-
114
-
115
-
116
-
117
-
118
-
119
-
120
-
121
-
122
-
123
-
124
-
125
-
126
-
127
-
128
-
129
-
130
-
131
-
132
-
133
-
134
-
135
-
136
-
137
-
138
-
139
-
140
-
141
-
142
-
143
-
144
-
145
-
146
-
147
-
148
-
149
-
150
-
151
-
152
-
153
-
154
-
155
-
156
-
157
-
158
-
159
-
160
-
161
-
162
-
163
-
164
-
165
-
166
-
167
-
168
-
169
-
170
-
171
-
172
-
173
-
174
-
175
-
176
-
177
-
178
-
179
-
180
-
181
-
182
-
183
-
184
-
185
-
186
-
187
-
188
-
189
-
190
-
191
-
192
-
193
-
194
-
195
-
196
-
197
-
198
-
199
-
200
-
201
-
202
-
203
-
204
-
205
-
206
-
207
-
208
-
209
-
210
-
211
-
212
-
213
-
214
-
215
-
216
-
217
-
218
-
219
-
220
-
221
-
222
-
223
-
224
-
225
-
226
-
227
-
228
-
229
-
230
-
231
-
232
-
233
-
234
-
235
-
236
-
237
-
238
-
239
-
240
-
241
-
242
-
243
-
244
-
245
-
246
-
247
-
248
-
249
-
250
-
251
-
 252
252 -
 253
253 -
 254
254 -
 255
255 -
 256
256 -
 257
257 -
 258
258 -
 259
259 -
 260
260 -
 261
261 -
 262
262 -
 263
263 -
 264
264 -
 265
265 -
 266
266 -
 267
267 -
 268
268 -
 269
269 -
 270
270 -
 271
271 -
 272
272 -
273
-
274
-
275
-
276
-
277
-
278
-
279
-
280
-
281
-
282
-
283
-
284
-
285
-
286
-
287
-
288
-
289
-
290
-
291
-
292
-
293
-
294
-
295
-
296
-
297
-
298
-
299
-
300
-
301
-
302
-
303
-
304
-
305
-
306
 |
 |

2014 FORM 10-K
THE WESTERN UNION COMPANY
NOTES TO CONSOLIDATED FINANCIAL STATEMENTS (Continued)
124
Differences in expected returns on plan assets estimated at the beginning of the year versus actual returns, and assumptions
used to estimate the beginning of year projected benefit obligation versus the end of year obligation (principally discount rate and
mortality assumptions) are, on a combined basis, considered actuarial gains and losses. Such actuarial gains and losses are recognized
as a component of "Comprehensive income" and amortized to income over the average remaining life expectancy of the plan
participants. Included in "Accumulated other comprehensive loss" as of December 31, 2014 is $11.5 million ($7.2 million, net of
tax) of actuarial losses that are expected to be recognized in net periodic benefit cost during the year ended December 31, 2015.
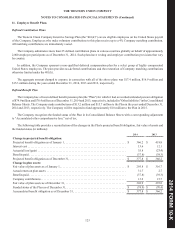
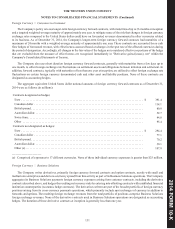
The following table provides the amounts recognized in the Consolidated Balance Sheets (in millions):
December 31,
2014 2013
Accrued benefit liability. . . . . . . . . . . . . . . . . . . . . . . . . . . . . . . . . . . . . . . . . . . . . . . . . . . . . . . . . $ (74.9) $ (70.4)
Accumulated other comprehensive loss (pre-tax) . . . . . . . . . . . . . . . . . . . . . . . . . . . . . . . . . . . . . 200.9 187.0
Net amount recognized. . . . . . . . . . . . . . . . . . . . . . . . . . . . . . . . . . . . . . . . . . . . . . . . . . . . . . . . . . $ 126.0 $ 116.6
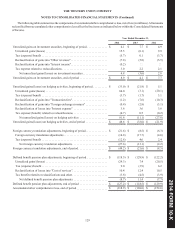
The following table provides the components of net periodic benefit cost for the Plan (in millions):
Year Ended December 31,
2014 2013 2012
Interest cost . . . . . . . . . . . . . . . . . . . . . . . . . . . . . . . . . . . . . . . . . . . . . . . . . . . . . . . . . $ 13.6 $ 12.1 $ 14.7
Expected return on plan assets . . . . . . . . . . . . . . . . . . . . . . . . . . . . . . . . . . . . . . . . . . (20.2)(20.7)(20.8)
Amortization of actuarial loss . . . . . . . . . . . . . . . . . . . . . . . . . . . . . . . . . . . . . . . . . . . 10.4 12.4 10.5
Net periodic benefit cost . . . . . . . . . . . . . . . . . . . . . . . . . . . . . . . . . . . . . . . . . . . . . . . $ 3.8 $ 3.8 $ 4.4
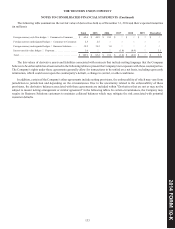
The rate assumptions used in the measurement of the Company's benefit obligation were as follows:
2014 2013
Discount rate . . . . . . . . . . . . . . . . . . . . . . . . . . . . . . . . . . . . . . . . . . . . . . . . . . . . . . . . . . . . . . . . . . . . . . . . . 3.27% 3.91%
The rate assumptions used in the measurement of the Company's net cost were as follows:
2014 2013 2012
Discount rate . . . . . . . . . . . . . . . . . . . . . . . . . . . . . . . . . . . . . . . . . . . . . . . . . . . . . . . . . . . . . . . . . . . 3.91% 3.03% 3.72%
Expected long-term return on plan assets . . . . . . . . . . . . . . . . . . . . . . . . . . . . . . . . . . . . . . . . . . . . . 7.00% 7.00% 7.00%
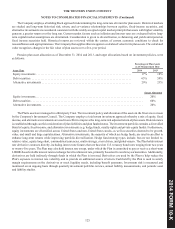
The Company measures the Plan's obligations and annual expense using assumptions that reflect best estimates and are
consistent to the extent that each assumption reflects expectations of future economic conditions. As the bulk of the pension benefits
will not be paid for many years, the computation of pension expenses and benefits is based on assumptions about future interest
rates and expected rates of return on plan assets. In general, pension obligations are most sensitive to the discount rate assumption,
and it is set based on the rate at which the pension benefits could be settled effectively. The discount rate is determined by matching
the timing and amount of anticipated payouts under the Plan to the rates from an AA spot rate yield curve. The curve is derived
from AA bonds of varying maturities.
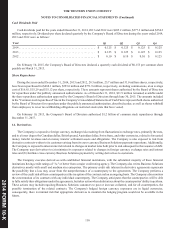
The estimated undiscounted future benefit payments are expected to be $36.4 million in 2015, $35.0 million in 2016, $33.5
million in 2017, $32.0 million in 2018, $30.5 million in 2019 and $128.5 million in 2020 through 2024.