Western Union 2014 Annual Report Download - page 244
Download and view the complete annual report
Please find page 244 of the 2014 Western Union annual report below. You can navigate through the pages in the report by either clicking on the pages listed below, or by using the keyword search tool below to find specific information within the annual report.-
 1
1 -
2
-
3
-
4
-
5
-
6
-
7
-
8
-
9
-
10
-
11
-
12
-
13
-
14
-
15
-
16
-
17
-
18
-
19
-
20
-
21
-
22
-
23
-
24
-
25
-
26
-
27
-
28
-
29
-
30
-
31
-
32
-
33
-
34
-
35
-
36
-
37
-
38
-
39
-
40
-
41
-
42
-
43
-
44
-
45
-
46
-
47
-
48
-
49
-
50
-
51
-
52
-
53
-
54
-
55
-
56
-
57
-
58
-
59
-
60
-
61
-
62
-
63
-
64
-
65
-
66
-
67
-
68
-
69
-
70
-
71
-
72
-
73
-
74
-
75
-
76
-
77
-
78
-
79
-
80
-
81
-
82
-
83
-
84
-
85
-
86
-
87
-
88
-
89
-
90
-
91
-
92
-
93
-
94
-
95
-
96
-
97
-
98
-
99
-
100
-
101
-
102
-
103
-
104
-
105
-
106
-
107
-
108
-
109
-
110
-
111
-
112
-
113
-
114
-
115
-
116
-
117
-
118
-
119
-
120
-
121
-
122
-
123
-
124
-
125
-
126
-
127
-
128
-
129
-
130
-
131
-
132
-
133
-
134
-
135
-
136
-
137
-
138
-
139
-
140
-
141
-
142
-
143
-
144
-
145
-
146
-
147
-
148
-
149
-
150
-
151
-
152
-
153
-
154
-
155
-
156
-
157
-
158
-
159
-
160
-
161
-
162
-
163
-
164
-
165
-
166
-
167
-
168
-
169
-
170
-
171
-
172
-
173
-
174
-
175
-
176
-
177
-
178
-
179
-
180
-
181
-
182
-
183
-
184
-
185
-
186
-
187
-
188
-
189
-
190
-
191
-
192
-
193
-
194
-
195
-
196
-
197
-
198
-
199
-
200
-
201
-
202
-
203
-
204
-
205
-
206
-
207
-
208
-
209
-
210
-
211
-
212
-
213
-
214
-
215
-
216
-
217
-
218
-
219
-
220
-
221
-
222
-
223
-
224
-
225
-
226
-
227
-
228
-
229
-
230
-
231
-
232
-
233
-
 234
234 -
 235
235 -
 236
236 -
 237
237 -
 238
238 -
 239
239 -
 240
240 -
 241
241 -
 242
242 -
 243
243 -
 244
244 -
 245
245 -
 246
246 -
 247
247 -
 248
248 -
 249
249 -
 250
250 -
 251
251 -
 252
252 -
 253
253 -
 254
254 -
255
-
256
-
257
-
258
-
259
-
260
-
261
-
262
-
263
-
264
-
265
-
266
-
267
-
268
-
269
-
270
-
271
-
272
-
273
-
274
-
275
-
276
-
277
-
278
-
279
-
280
-
281
-
282
-
283
-
284
-
285
-
286
-
287
-
288
-
289
-
290
-
291
-
292
-
293
-
294
-
295
-
296
-
297
-
298
-
299
-
300
-
301
-
302
-
303
-
304
-
305
-
306
 |
 |

2014 FORM 10-K
THE WESTERN UNION COMPANY
NOTES TO CONSOLIDATED FINANCIAL STATEMENTS (Continued)
106
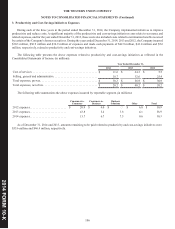
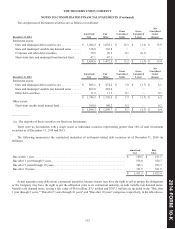
3. Productivity and Cost-Savings Initiatives Expenses
During each of the three years in the period ended December 31, 2014, the Company implemented initiatives to improve
productivity and reduce costs. A significant majority of the productivity and cost-savings initiatives costs relate to severance and
related expenses, and for the year ended December 31, 2013, these costs also included costs related to termination benefits received
by certain of the Company's former executives. During the years ended December 31, 2014, 2013 and 2012, the Company incurred
$30.3 million, $56.9 million and $30.9 million of expenses and made cash payments of $42.9 million, $41.8 million and $5.6
million, respectively, related to productivity and cost-savings initiatives.
The following table presents the above expenses related to productivity and cost-savings initiatives as reflected in the
Consolidated Statements of Income (in millions):
Year Ended December 31,
2014 2013 2012
Cost of services . . . . . . . . . . . . . . . . . . . . . . . . . . . . . . . . . . . . . . . . . . . . $ 11.6 $ 24.3 $ 5.5
Selling, general and administrative . . . . . . . . . . . . . . . . . . . . . . . . . . . . . 18.7 32.6 25.4
Total expenses, pre-tax. . . . . . . . . . . . . . . . . . . . . . . . . . . . . . . . . . . . . . . $ 30.3 $ 56.9 $ 30.9
Total expenses, net of tax. . . . . . . . . . . . . . . . . . . . . . . . . . . . . . . . . . . . . $ 20.2 $ 40.2 $ 20.2
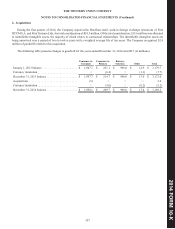
The following table summarizes the above expenses incurred by reportable segment (in millions):
Consumer-to-
Consumer Consumer-to-
Business Business
Solutions Other Total
2012 expenses. . . . . . . . . . . . . . . . . . . . . . . . . $ 20.9 $ 4.0 $ — $ 6.0 $ 30.9
2013 expenses. . . . . . . . . . . . . . . . . . . . . . . . . 43.8 5.4 3.6 4.1 56.9
2014 expenses. . . . . . . . . . . . . . . . . . . . . . . . . 15.7 6.7 7.3 0.6 30.3
As of December 31, 2014 and 2013, amounts remaining to be paid related to productivity and cost-savings initiatives were
$33.6 million and $46.4 million, respectively.