Western Union 2014 Annual Report Download - page 205
Download and view the complete annual report
Please find page 205 of the 2014 Western Union annual report below. You can navigate through the pages in the report by either clicking on the pages listed below, or by using the keyword search tool below to find specific information within the annual report.-
 1
1 -
2
-
3
-
4
-
5
-
6
-
7
-
8
-
9
-
10
-
11
-
12
-
13
-
14
-
15
-
16
-
17
-
18
-
19
-
20
-
21
-
22
-
23
-
24
-
25
-
26
-
27
-
28
-
29
-
30
-
31
-
32
-
33
-
34
-
35
-
36
-
37
-
38
-
39
-
40
-
41
-
42
-
43
-
44
-
45
-
46
-
47
-
48
-
49
-
50
-
51
-
52
-
53
-
54
-
55
-
56
-
57
-
58
-
59
-
60
-
61
-
62
-
63
-
64
-
65
-
66
-
67
-
68
-
69
-
70
-
71
-
72
-
73
-
74
-
75
-
76
-
77
-
78
-
79
-
80
-
81
-
82
-
83
-
84
-
85
-
86
-
87
-
88
-
89
-
90
-
91
-
92
-
93
-
94
-
95
-
96
-
97
-
98
-
99
-
100
-
101
-
102
-
103
-
104
-
105
-
106
-
107
-
108
-
109
-
110
-
111
-
112
-
113
-
114
-
115
-
116
-
117
-
118
-
119
-
120
-
121
-
122
-
123
-
124
-
125
-
126
-
127
-
128
-
129
-
130
-
131
-
132
-
133
-
134
-
135
-
136
-
137
-
138
-
139
-
140
-
141
-
142
-
143
-
144
-
145
-
146
-
147
-
148
-
149
-
150
-
151
-
152
-
153
-
154
-
155
-
156
-
157
-
158
-
159
-
160
-
161
-
162
-
163
-
164
-
165
-
166
-
167
-
168
-
169
-
170
-
171
-
172
-
173
-
174
-
175
-
176
-
177
-
178
-
179
-
180
-
181
-
182
-
183
-
184
-
185
-
186
-
187
-
188
-
189
-
190
-
191
-
192
-
193
-
194
-
 195
195 -
 196
196 -
 197
197 -
 198
198 -
 199
199 -
 200
200 -
 201
201 -
 202
202 -
 203
203 -
 204
204 -
 205
205 -
 206
206 -
 207
207 -
 208
208 -
 209
209 -
 210
210 -
 211
211 -
 212
212 -
 213
213 -
 214
214 -
 215
215 -
216
-
217
-
218
-
219
-
220
-
221
-
222
-
223
-
224
-
225
-
226
-
227
-
228
-
229
-
230
-
231
-
232
-
233
-
234
-
235
-
236
-
237
-
238
-
239
-
240
-
241
-
242
-
243
-
244
-
245
-
246
-
247
-
248
-
249
-
250
-
251
-
252
-
253
-
254
-
255
-
256
-
257
-
258
-
259
-
260
-
261
-
262
-
263
-
264
-
265
-
266
-
267
-
268
-
269
-
270
-
271
-
272
-
273
-
274
-
275
-
276
-
277
-
278
-
279
-
280
-
281
-
282
-
283
-
284
-
285
-
286
-
287
-
288
-
289
-
290
-
291
-
292
-
293
-
294
-
295
-
296
-
297
-
298
-
299
-
300
-
301
-
302
-
303
-
304
-
305
-
306
 |
 |

2014 FORM 10-K
67
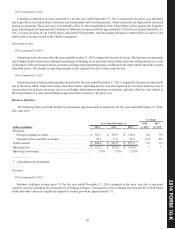
We have historically implemented and will likely continue to implement price reductions from time to time in response to
competition and other factors. Price reductions generally reduce margins and adversely affect financial results in the short term
and may also adversely affect financial results in the long term if transaction volumes do not increase sufficiently. Consumer-to-
Consumer price reductions totaled approximately 1% of both our Consumer-to-Consumer revenue and consolidated revenue for
the year ended December 31, 2014.
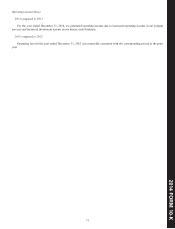
2013 compared to 2012
For the year ended December 31, 2013 compared to the prior year, Consumer-to-Consumer money transfer revenue declined
3% primarily due to price reductions and compliance related actions in various corridors. Transactions increased 5% from 2012,
primarily due to price reductions.
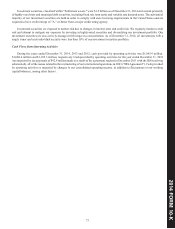
Beginning in the fourth quarter of 2012, we implemented additional fee reductions and actions to adjust foreign exchange
spreads that impacted approximately 25% of our Consumer-to-Consumer business, based on 2012 revenue. We had initiated
substantially all of these pricing reductions as of June 30, 2013. These pricing actions totaled approximately 5% of consolidated
revenue and 7% of our Consumer-to-Consumer revenue, for the full year 2013.
The regions discussed below were impacted by price reductions in certain key corridors and compliance related actions in
various corridors.
For the year ended December 31, 2013 compared to the prior year, revenue in our Europe and CIS region decreased 4% on
transaction growth of 4%. Revenue was negatively impacted by price reductions, compliance related actions in various countries,
including in the United Kingdom and Spain, competitive challenges in Russia, and continued economic softness in Southern
Europe, partially offset by revenue growth in Germany.
For the year ended December 31, 2013 compared to the prior year, our North America region experienced revenue declines
of 9% on flat transactions. Our North America region was impacted by Mexico, where revenue declined due to price reductions
and compliance related actions resulting from our settlement agreement with the State of Arizona and changes to our business
model, primarily for our Vigo® and Orlandi ValutaSM brands. These changes resulted in the loss of over 7,000 agent locations in
the third quarter of 2012. Transactions increased in Mexico for the year ended December 31, 2013, primarily due to price reductions,
partially offset by the impact of compliance related actions described earlier in this paragraph. Our North America region was also
impacted by our United States outbound corridor, which also experienced a decline in revenue due to price reductions and compliance
related actions resulting from our settlement agreement with the State of Arizona and changes to our business model, primarily
impacting our Vigo brand to Latin America, and other compliance related actions.
For the year ended December 31, 2013 compared to the prior year, our Middle East and Africa and APAC regions experienced
flat revenue and a revenue decline of 3%, respectively. Both regions experienced transaction growth in the year ended December
31, 2013 compared to the prior year. The differential between revenue and transaction changes for both regions was primarily
attributable to price reductions.
Our LACA region experienced revenue declines for the year ended December 31, 2013 compared to the prior year due to
compliance related actions resulting from our settlement agreement with the State of Arizona and changes to our business model,
primarily impacting our Vigo brand, and other compliance related actions. Revenue was also negatively impacted by pricing actions
and the strengthening of the United States dollar compared to most other foreign currencies in the region, partially offset by
geographic and product mix. Transactions decreased for the year ended December 31, 2013 compared to the prior year, primarily
due to the impact of compliance related actions described earlier, partially offset by price reductions.
Revenue generated from transactions initiated at westernunion.com increased for the year ended December 31, 2013 compared
to the prior year due to strong transaction growth, partially offset by price reductions.
Foreign exchange revenues for the year ended December 31, 2013 compared to the prior year were impacted primarily by
price reductions in certain corridors, partially offset by an increase in cross-border principal sent of 4%.