Western Union 2014 Annual Report Download - page 18
Download and view the complete annual report
Please find page 18 of the 2014 Western Union annual report below. You can navigate through the pages in the report by either clicking on the pages listed below, or by using the keyword search tool below to find specific information within the annual report.-
 1
1 -
2
-
3
-
4
-
5
-
6
-
7
-
 8
8 -
 9
9 -
 10
10 -
 11
11 -
 12
12 -
 13
13 -
 14
14 -
 15
15 -
 16
16 -
 17
17 -
 18
18 -
 19
19 -
 20
20 -
 21
21 -
 22
22 -
 23
23 -
 24
24 -
 25
25 -
 26
26 -
 27
27 -
 28
28 -
29
-
30
-
31
-
32
-
33
-
34
-
35
-
36
-
37
-
38
-
39
-
40
-
41
-
42
-
43
-
44
-
45
-
46
-
47
-
48
-
49
-
50
-
51
-
52
-
53
-
54
-
55
-
56
-
57
-
58
-
59
-
60
-
61
-
62
-
63
-
64
-
65
-
66
-
67
-
68
-
69
-
70
-
71
-
72
-
73
-
74
-
75
-
76
-
77
-
78
-
79
-
80
-
81
-
82
-
83
-
84
-
85
-
86
-
87
-
88
-
89
-
90
-
91
-
92
-
93
-
94
-
95
-
96
-
97
-
98
-
99
-
100
-
101
-
102
-
103
-
104
-
105
-
106
-
107
-
108
-
109
-
110
-
111
-
112
-
113
-
114
-
115
-
116
-
117
-
118
-
119
-
120
-
121
-
122
-
123
-
124
-
125
-
126
-
127
-
128
-
129
-
130
-
131
-
132
-
133
-
134
-
135
-
136
-
137
-
138
-
139
-
140
-
141
-
142
-
143
-
144
-
145
-
146
-
147
-
148
-
149
-
150
-
151
-
152
-
153
-
154
-
155
-
156
-
157
-
158
-
159
-
160
-
161
-
162
-
163
-
164
-
165
-
166
-
167
-
168
-
169
-
170
-
171
-
172
-
173
-
174
-
175
-
176
-
177
-
178
-
179
-
180
-
181
-
182
-
183
-
184
-
185
-
186
-
187
-
188
-
189
-
190
-
191
-
192
-
193
-
194
-
195
-
196
-
197
-
198
-
199
-
200
-
201
-
202
-
203
-
204
-
205
-
206
-
207
-
208
-
209
-
210
-
211
-
212
-
213
-
214
-
215
-
216
-
217
-
218
-
219
-
220
-
221
-
222
-
223
-
224
-
225
-
226
-
227
-
228
-
229
-
230
-
231
-
232
-
233
-
234
-
235
-
236
-
237
-
238
-
239
-
240
-
241
-
242
-
243
-
244
-
245
-
246
-
247
-
248
-
249
-
250
-
251
-
252
-
253
-
254
-
255
-
256
-
257
-
258
-
259
-
260
-
261
-
262
-
263
-
264
-
265
-
266
-
267
-
268
-
269
-
270
-
271
-
272
-
273
-
274
-
275
-
276
-
277
-
278
-
279
-
280
-
281
-
282
-
283
-
284
-
285
-
286
-
287
-
288
-
289
-
290
-
291
-
292
-
293
-
294
-
295
-
296
-
297
-
298
-
299
-
300
-
301
-
302
-
303
-
304
-
305
-
306
 |
 |
Proxy Summary PROXY STATEMENT
The Western Union Company – Proxy Statement | vi
NOTICE OF 2015 ANNUAL MEETING OF STOCKHOLDERS AND PROXY STATEMENT
Cash and All Other
Compensation
Equity-Based
Awards
Total Reported
Compensation(2)
201420132012
In $ millions
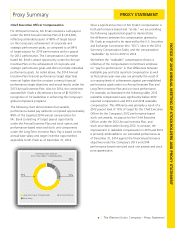
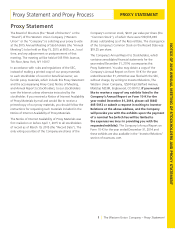
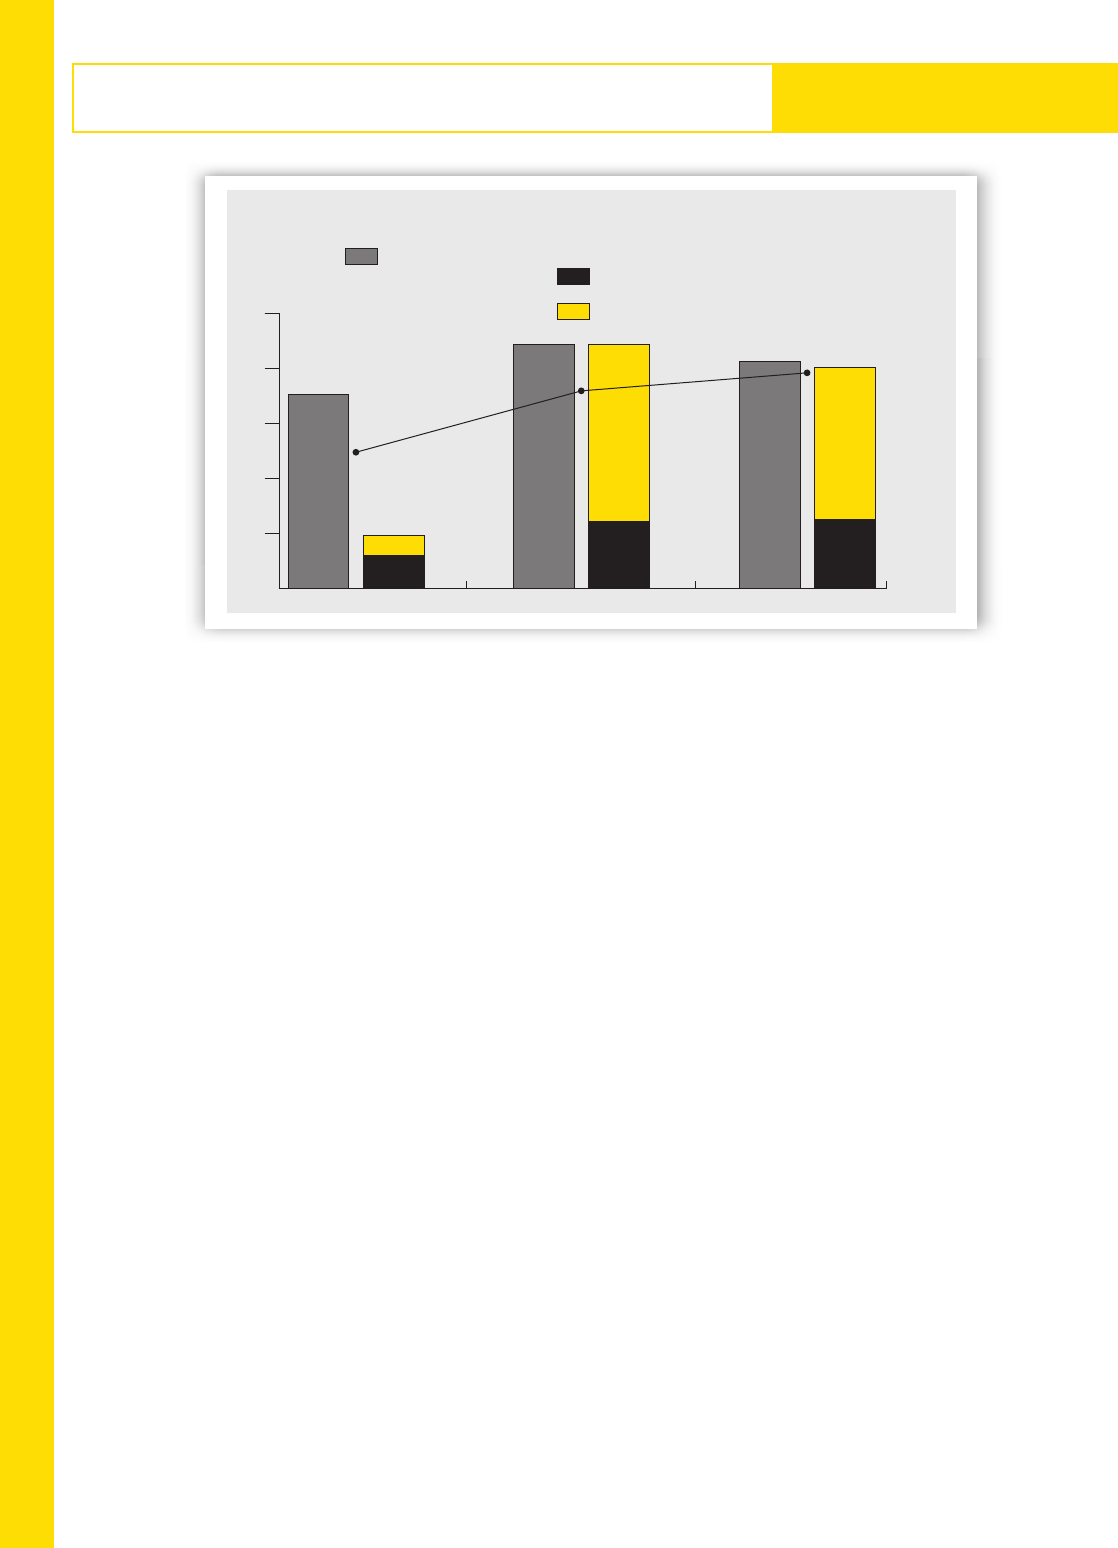
2014 Chief Executive Officer Total Reported Compensation
Versus Total Realizable Compensation(1)
7.0
1.8
0.5
1.3
8.8 8.8
6.4
2.4
8.2 8.0
5.5
2.5
Total Realizable Compensation(3):
0
2
4
6
8
10
$13.61(4)
$17.25(4)
$17.91(4)
(1) This graph and the total realizable compensation reported in this graph provides supplemental information
regarding the compensation paid to Mr. Ersek and should not be viewed as a substitute for the 2014 Summary
Compensation Table.
(2) As reported in the Total column of the 2014 Summary Compensation Table.
(3) Amounts reported in the calculation of total realizable compensation include (a) annualized base salary, (b) actual
bonus payments made to Mr. Ersek with respect to each of the years shown under the Company’s Annual Incentive
Plan, (c) actual amounts paid with respect to discretionary bonuses in the year in which such bonuses are paid,
(d) the value realized from the exercise of stock options and for unexercised stock options, the difference between
the exercise price and the closing stock price on December 31, 2014, each reported in the year granted, (e) the
value realized upon vesting of restricted stock units or performance-based restricted stock units and the value of
unvested restricted stock units or performance-based restricted stock unit awards based on the closing stock price
on December 31, 2014, each reported in the year granted, and (f) amounts reported in the All Other Compensation
Table for the respective years. For purposes of this table, the value of the TSR PSUs is based on target performance
since the TSR PSUs vest based on the Company’s TSR at the end of the three-year performance period compared to
the Company’s TSR at the beginning of the performance period. The Financial PSUs and the 2013 performance-based
restricted stock unit awards are valued for purposes of this table based on estimated performance as of
December 31, 2014.
(4) Closing stock price as of December 31 for each year reported.