Western Union 2014 Annual Report Download - page 51
Download and view the complete annual report
Please find page 51 of the 2014 Western Union annual report below. You can navigate through the pages in the report by either clicking on the pages listed below, or by using the keyword search tool below to find specific information within the annual report.-
 1
1 -
2
-
3
-
4
-
5
-
6
-
7
-
8
-
9
-
10
-
11
-
12
-
13
-
14
-
15
-
16
-
17
-
18
-
19
-
20
-
21
-
22
-
23
-
24
-
25
-
26
-
27
-
28
-
29
-
30
-
31
-
32
-
33
-
34
-
35
-
36
-
37
-
38
-
39
-
40
-
 41
41 -
 42
42 -
 43
43 -
 44
44 -
 45
45 -
 46
46 -
 47
47 -
 48
48 -
 49
49 -
 50
50 -
 51
51 -
 52
52 -
 53
53 -
 54
54 -
 55
55 -
 56
56 -
 57
57 -
 58
58 -
 59
59 -
 60
60 -
 61
61 -
62
-
63
-
64
-
65
-
66
-
67
-
68
-
69
-
70
-
71
-
72
-
73
-
74
-
75
-
76
-
77
-
78
-
79
-
80
-
81
-
82
-
83
-
84
-
85
-
86
-
87
-
88
-
89
-
90
-
91
-
92
-
93
-
94
-
95
-
96
-
97
-
98
-
99
-
100
-
101
-
102
-
103
-
104
-
105
-
106
-
107
-
108
-
109
-
110
-
111
-
112
-
113
-
114
-
115
-
116
-
117
-
118
-
119
-
120
-
121
-
122
-
123
-
124
-
125
-
126
-
127
-
128
-
129
-
130
-
131
-
132
-
133
-
134
-
135
-
136
-
137
-
138
-
139
-
140
-
141
-
142
-
143
-
144
-
145
-
146
-
147
-
148
-
149
-
150
-
151
-
152
-
153
-
154
-
155
-
156
-
157
-
158
-
159
-
160
-
161
-
162
-
163
-
164
-
165
-
166
-
167
-
168
-
169
-
170
-
171
-
172
-
173
-
174
-
175
-
176
-
177
-
178
-
179
-
180
-
181
-
182
-
183
-
184
-
185
-
186
-
187
-
188
-
189
-
190
-
191
-
192
-
193
-
194
-
195
-
196
-
197
-
198
-
199
-
200
-
201
-
202
-
203
-
204
-
205
-
206
-
207
-
208
-
209
-
210
-
211
-
212
-
213
-
214
-
215
-
216
-
217
-
218
-
219
-
220
-
221
-
222
-
223
-
224
-
225
-
226
-
227
-
228
-
229
-
230
-
231
-
232
-
233
-
234
-
235
-
236
-
237
-
238
-
239
-
240
-
241
-
242
-
243
-
244
-
245
-
246
-
247
-
248
-
249
-
250
-
251
-
252
-
253
-
254
-
255
-
256
-
257
-
258
-
259
-
260
-
261
-
262
-
263
-
264
-
265
-
266
-
267
-
268
-
269
-
270
-
271
-
272
-
273
-
274
-
275
-
276
-
277
-
278
-
279
-
280
-
281
-
282
-
283
-
284
-
285
-
286
-
287
-
288
-
289
-
290
-
291
-
292
-
293
-
294
-
295
-
296
-
297
-
298
-
299
-
300
-
301
-
302
-
303
-
304
-
305
-
306
 |
 |

33 | The Western Union Company – Proxy Statement
NOTICE OF 2015 ANNUAL MEETING OF STOCKHOLDERS AND PROXY STATEMENT
Compensation Discussion and Analysis PROXY STATEMENT
equity awards under the Long-Term Incentive Plan
consisted of 80% performance-based restricted stock
units (60% Financial PSUs, incorporating both revenue
and operating income growth and 20% TSR PSUs) and
20% stock options, as compared to 67% performance-
based restricted stock units and 33% stock options
in 2013.
• Established Goals Exceeding Performance During
Prior Three Years: The financial performance target
objectives for the 2014 compensation program were
set at constant currency growth rates that are higher
than the Company’s average annual constant currency
results achieved over 2011 through 2013. The 2014
Annual Incentive Plan financial performance target
objectives were also set higher than the constant
currency financial performance target objectives and
actual results under the 2013 Annual Incentive Plan. For
the 2014 Annual Incentive Plan, performance at 184%
of the target revenue growth rate and at 200% of the
target operating income growth rate is required for a
maximum payout equal to 150% of the target award.
Further, the Company’s relative TSR performance
rank versus the S&P 500 Index over the 2014-2016
performance period that is required to earn a target
payout under the 2014 TSR PSUs is higher than the
Company’s annual relative TSR performance versus the
S&P 500 Index in each of 2011, 2012, and 2013.
• Reduced Maximum Payout Under Annual
Incentive Plan: The Compensation Committee reduced
the maximum payout opportunity under the Annual
Incentive Plan to 150% of target, as compared to the
200% of target maximum payout opportunity that was
used in prior years.
• Reduced Severance Benefits Under Executive
Severance Policy: During 2014, the Compensation
Committee amended the Executive Severance Policy
to reduce the severance multiple for determining
severance benefits prior to a change-in-control from
2 to 1.5 for participants other than the Company’s
Chief Executive Officer.
Chief Executive Officer Compensation
For 2014 performance, Mr. Ersek received a cash payout
under the 2014 Annual Incentive Plan of $1,314,800,
reflecting a blended payout of 88% of target based
on the Company’s achievement of corporate and
strategic performance goals, as compared to an 84%
of target payout for 2013 performance and no payout
for 2012 performance. The Compensation Committee
based Mr. Ersek’s award opportunity under the Annual
Incentive Plan on the achievement of corporate and
strategic performance goals and did not include individual
performance goals. As noted above, the 2014 Annual
Incentive Plan financial performance target objectives
were set higher than the constant currency financial
performance target objectives and actual results under the
2013 Annual Incentive Plan. Also for 2014, the committee
awarded Mr. Ersekadiscretionarybonusof$115,000in
recognition of his leadership in enhancing the Company’s
global compliance programs.
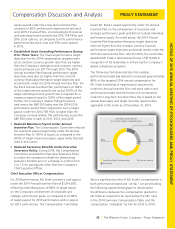
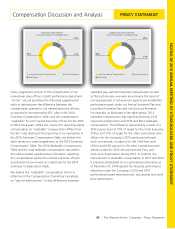
The following chart demonstrates that variable,
performance-based pay elements comprised approximately
88% of the targeted 2014 annual compensation for
Mr. Ersek (consisting of target payout opportunity
under the Annual Incentive Plan and stock option and
performance-based restricted stock unit components
under the Long-Term Incentive Plan). Pay is based on the
annual base salary and target incentive opportunities
applicable to Mr. Ersek as of December 31, 2014.
17%
12%
71%
Annual Incentive
Base Salary
Long-Term Equity Compensation
CHIEF EXECUTIVE OFFICER
2014 TOTAL DIRECT COMPENSATION
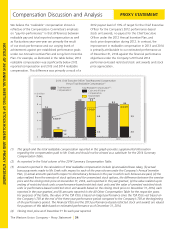
Since a significant portion of Mr. Ersek’s compensation is
both performance-based and “at-risk,” we are providing
the following supplemental graph to demonstrate
the difference between the compensation granted to
Mr. Ersek as required to be reported by the SEC rules
in the 2014 Summary Compensation Table, and the
compensation “realizable” by him for 2012 to 2014.