Western Union 2014 Annual Report Download - page 61
Download and view the complete annual report
Please find page 61 of the 2014 Western Union annual report below. You can navigate through the pages in the report by either clicking on the pages listed below, or by using the keyword search tool below to find specific information within the annual report.-
 1
1 -
2
-
3
-
4
-
5
-
6
-
7
-
8
-
9
-
10
-
11
-
12
-
13
-
14
-
15
-
16
-
17
-
18
-
19
-
20
-
21
-
22
-
23
-
24
-
25
-
26
-
27
-
28
-
29
-
30
-
31
-
32
-
33
-
34
-
35
-
36
-
37
-
38
-
39
-
40
-
41
-
42
-
43
-
44
-
45
-
46
-
47
-
48
-
49
-
50
-
 51
51 -
 52
52 -
 53
53 -
 54
54 -
 55
55 -
 56
56 -
 57
57 -
 58
58 -
 59
59 -
 60
60 -
 61
61 -
 62
62 -
 63
63 -
 64
64 -
 65
65 -
 66
66 -
 67
67 -
 68
68 -
 69
69 -
 70
70 -
 71
71 -
72
-
73
-
74
-
75
-
76
-
77
-
78
-
79
-
80
-
81
-
82
-
83
-
84
-
85
-
86
-
87
-
88
-
89
-
90
-
91
-
92
-
93
-
94
-
95
-
96
-
97
-
98
-
99
-
100
-
101
-
102
-
103
-
104
-
105
-
106
-
107
-
108
-
109
-
110
-
111
-
112
-
113
-
114
-
115
-
116
-
117
-
118
-
119
-
120
-
121
-
122
-
123
-
124
-
125
-
126
-
127
-
128
-
129
-
130
-
131
-
132
-
133
-
134
-
135
-
136
-
137
-
138
-
139
-
140
-
141
-
142
-
143
-
144
-
145
-
146
-
147
-
148
-
149
-
150
-
151
-
152
-
153
-
154
-
155
-
156
-
157
-
158
-
159
-
160
-
161
-
162
-
163
-
164
-
165
-
166
-
167
-
168
-
169
-
170
-
171
-
172
-
173
-
174
-
175
-
176
-
177
-
178
-
179
-
180
-
181
-
182
-
183
-
184
-
185
-
186
-
187
-
188
-
189
-
190
-
191
-
192
-
193
-
194
-
195
-
196
-
197
-
198
-
199
-
200
-
201
-
202
-
203
-
204
-
205
-
206
-
207
-
208
-
209
-
210
-
211
-
212
-
213
-
214
-
215
-
216
-
217
-
218
-
219
-
220
-
221
-
222
-
223
-
224
-
225
-
226
-
227
-
228
-
229
-
230
-
231
-
232
-
233
-
234
-
235
-
236
-
237
-
238
-
239
-
240
-
241
-
242
-
243
-
244
-
245
-
246
-
247
-
248
-
249
-
250
-
251
-
252
-
253
-
254
-
255
-
256
-
257
-
258
-
259
-
260
-
261
-
262
-
263
-
264
-
265
-
266
-
267
-
268
-
269
-
270
-
271
-
272
-
273
-
274
-
275
-
276
-
277
-
278
-
279
-
280
-
281
-
282
-
283
-
284
-
285
-
286
-
287
-
288
-
289
-
290
-
291
-
292
-
293
-
294
-
295
-
296
-
297
-
298
-
299
-
300
-
301
-
302
-
303
-
304
-
305
-
306
 |
 |

43 | The Western Union Company – Proxy Statement
NOTICE OF 2015 ANNUAL MEETING OF STOCKHOLDERS AND PROXY STATEMENT
Compensation Discussion and Analysis PROXY STATEMENT
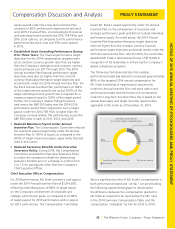
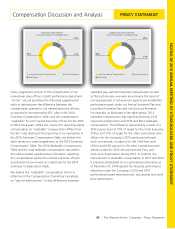
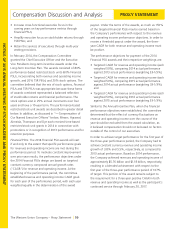
17%
12%
71%
Annual Incentive
Base Salary
Long-Term Equity Compensation
CHIEF EXECUTIVE OFFICER
2014 TOTAL DIRECT COMPENSATION
21%
25%
54%
Annual Incentive
Base Salary
Long-Term Equity Compensation
NAMED EXECUTIVE OFFICERS
2014 TOTAL DIRECT COMPENSATION
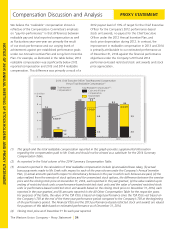
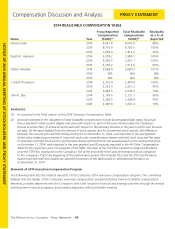
Since a significant portion of the compensation of our
named executive officers is both performance-based and
“at-risk,” we are providing the following supplemental
table to demonstrate the difference between the
compensation granted to our named executive officers,
as required to be reported by SEC rules in the 2014
Summary Compensation Table, and the compensation
“realizable” by such named executive officers for the 2012
to 2014 fiscal years. While the manner for reporting equity
compensation as “realizable” compensation differs from
the SEC rules relating to the reporting of compensation in
the 2014 Summary Compensation Table, we believe this
table serves as a useful supplement to the 2014 Summary
Compensation Table. The 2014 Realizable Compensation
Table and the total realizable compensation reported in
the table provides supplemental information regarding
the compensation paid to the named executive officers
and should not be viewed as a substitute for the 2014
Summary Compensation Table.
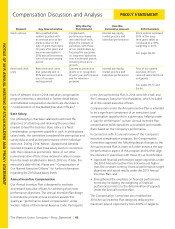
We believe the “realizable” compensation shown is
reflective of the Compensation Committee’s emphasis
on “pay-for-performance” in that differences between
realizable pay and total reported compensation as well
as fluctuations year-over-year are primarily the result of
our varying levels of achievement against pre-established
performance goals under our Annual Incentive Plan and
Long-Term Incentive Plan and our stock performance.
For example, as illustrated in the table below, 2012
realizable compensation was significantly below 2012
reported compensation and 2013 and 2014 realizable
compensation. This difference was primarily a result of a
2012 payout level of 13% of target for the Chief Executive
Officer and 17% of target for the other named executive
officers for the Company’s 2012 performance-based
stock unit awards, no payout for the Chief Executive
Officer and 24% payout for the other named executive
officers under the 2012 Annual Incentive Plan, and
stock price depreciation during 2012. In contrast, the
improvement in realizable compensation in 2013 and 2014
is primarily attributable to our estimated performance as
of December 31, 2014 against the financial performance
objectives under the Company’s 2013 and 2014
performance-based restricted stock unit awards and stock
price appreciation.