Western Union 2014 Annual Report Download - page 68
Download and view the complete annual report
Please find page 68 of the 2014 Western Union annual report below. You can navigate through the pages in the report by either clicking on the pages listed below, or by using the keyword search tool below to find specific information within the annual report.-
 1
1 -
2
-
3
-
4
-
5
-
6
-
7
-
8
-
9
-
10
-
11
-
12
-
13
-
14
-
15
-
16
-
17
-
18
-
19
-
20
-
21
-
22
-
23
-
24
-
25
-
26
-
27
-
28
-
29
-
30
-
31
-
32
-
33
-
34
-
35
-
36
-
37
-
38
-
39
-
40
-
41
-
42
-
43
-
44
-
45
-
46
-
47
-
48
-
49
-
50
-
51
-
52
-
53
-
54
-
55
-
56
-
57
-
 58
58 -
 59
59 -
 60
60 -
 61
61 -
 62
62 -
 63
63 -
 64
64 -
 65
65 -
 66
66 -
 67
67 -
 68
68 -
 69
69 -
 70
70 -
 71
71 -
 72
72 -
 73
73 -
 74
74 -
 75
75 -
 76
76 -
 77
77 -
 78
78 -
79
-
80
-
81
-
82
-
83
-
84
-
85
-
86
-
87
-
88
-
89
-
90
-
91
-
92
-
93
-
94
-
95
-
96
-
97
-
98
-
99
-
100
-
101
-
102
-
103
-
104
-
105
-
106
-
107
-
108
-
109
-
110
-
111
-
112
-
113
-
114
-
115
-
116
-
117
-
118
-
119
-
120
-
121
-
122
-
123
-
124
-
125
-
126
-
127
-
128
-
129
-
130
-
131
-
132
-
133
-
134
-
135
-
136
-
137
-
138
-
139
-
140
-
141
-
142
-
143
-
144
-
145
-
146
-
147
-
148
-
149
-
150
-
151
-
152
-
153
-
154
-
155
-
156
-
157
-
158
-
159
-
160
-
161
-
162
-
163
-
164
-
165
-
166
-
167
-
168
-
169
-
170
-
171
-
172
-
173
-
174
-
175
-
176
-
177
-
178
-
179
-
180
-
181
-
182
-
183
-
184
-
185
-
186
-
187
-
188
-
189
-
190
-
191
-
192
-
193
-
194
-
195
-
196
-
197
-
198
-
199
-
200
-
201
-
202
-
203
-
204
-
205
-
206
-
207
-
208
-
209
-
210
-
211
-
212
-
213
-
214
-
215
-
216
-
217
-
218
-
219
-
220
-
221
-
222
-
223
-
224
-
225
-
226
-
227
-
228
-
229
-
230
-
231
-
232
-
233
-
234
-
235
-
236
-
237
-
238
-
239
-
240
-
241
-
242
-
243
-
244
-
245
-
246
-
247
-
248
-
249
-
250
-
251
-
252
-
253
-
254
-
255
-
256
-
257
-
258
-
259
-
260
-
261
-
262
-
263
-
264
-
265
-
266
-
267
-
268
-
269
-
270
-
271
-
272
-
273
-
274
-
275
-
276
-
277
-
278
-
279
-
280
-
281
-
282
-
283
-
284
-
285
-
286
-
287
-
288
-
289
-
290
-
291
-
292
-
293
-
294
-
295
-
296
-
297
-
298
-
299
-
300
-
301
-
302
-
303
-
304
-
305
-
306
 |
 |

Compensation Discussion and Analysis PROXY STATEMENT
The Western Union Company – Proxy Statement | 50
NOTICE OF 2015 ANNUAL MEETING OF STOCKHOLDERS AND PROXY STATEMENT
• Increase cross-functional executive focus in the
coming years on key performance metrics through
Financial PSUs;
• Amplify executive focus on stockholder returns through
TSR PSUs; and
• Retain the services of executives through multi-year
vesting provisions.
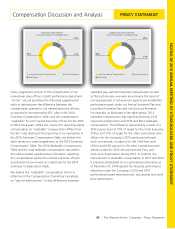
In February 2014, the Compensation Committee
granted the Chief Executive Officer and the Executive
Vice Presidents long-term incentive awards under the
Long-Term Incentive Plan. The awards consisted of 80%
performance-based restricted stock units (60% Financial
PSUs, incorporating both revenue and operating income
growth, and 20% TSR PSUs) and 20% stock options. The
committee believed that the mix of stock options, Financial
PSUs and TSR PSUs was appropriate because these forms
of awards combined represented a balanced reflection
of stockholder returns and financial performance. The
stock options vest in 25% annual increments over four
years and have a 10-year term. The performance-based
restricted stock unit awards are described in greater detail
below. In addition, as discussed in “—Compensation of
Our Named Executive Officers” below, Messrs. Agrawal,
Almeida, Thompson and Dye each received time-based
restricted stock unit grants in 2014 in connection with
promotions or in recognition of 2013 performance and for
retention purposes.
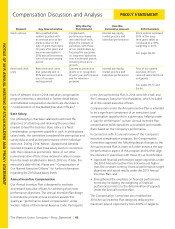
Financial PSUs. The 2014 Financial PSU awards will vest
if and only to the extent that specific performance goals
for revenues and operating income are met during the
performance period. To motivate constant improvement
over prior year results, the performance objectives under
the 2014 Financial PSUs design are based on targeted
constant currency compound annual growth rates
(“CAGR”) for revenue and operating income. At the
beginning of the performance period, the committee
established revenue and operating income CAGR goals
for each year of the performance period, with each year
weighted equally in the determination of the award
payout. Under the terms of the awards, as much as 150%
of the targeted Financial PSUs may be earned based on
the Company’s performance with respect to the revenue
and operating income performance objectives. In order to
receive a threshold payout under the award, the three-
year CAGR for both revenue and operating income must
be positive.
The performance objectives for payment of the 2014
Financial PSU awards and their respective weightings are:
• TargetedCAGRforrevenueandoperatingincome(each
weighted 50%), comparing 2014 actual performance
against 2013 actual performance (weighting 33-1/3%);
• TargetedCAGRforrevenueandoperatingincome(each
weighted 50%), comparing 2015 actual performance
against 2014 actual performance (weighting 33-1/3%);
and
• TargetedCAGRforrevenueandoperatingincome(each
weighted 50%), comparing 2016 actual performance
against 2015 actual performance (weighting 33-1/3%).
Similar to the Annual Incentive Plan, when the financial
performance objectives were established, the committee
determined that the effect of currency fluctuations on
revenue and operating income over the course of the
year should be excluded from the award calculation, as
it believed compensation should not be based on factors
outside of the control of our executives.
In order to achieve target performance for the first year of
the three-year performance period, the Company had to
achieve constant currency revenue and operating income
growth of 3.8% and 5.5%, respectively, as compared to
2013 actual performance. Based on 2014 performance,
the Company achieved revenues and operating income of
approximately $5.76 billion and $1.18 billion, respectively,
resulting in a blended achievement with respect to the
first year of the three-year performance period of 107%
of target. This portion of the award remains subject to
the requirement for a three-year positive CAGR in both
revenue and operating income as well as the participant’s
continued service through February 20, 2017.