Western Union 2014 Annual Report Download - page 265
Download and view the complete annual report
Please find page 265 of the 2014 Western Union annual report below. You can navigate through the pages in the report by either clicking on the pages listed below, or by using the keyword search tool below to find specific information within the annual report.-
 1
1 -
2
-
3
-
4
-
5
-
6
-
7
-
8
-
9
-
10
-
11
-
12
-
13
-
14
-
15
-
16
-
17
-
18
-
19
-
20
-
21
-
22
-
23
-
24
-
25
-
26
-
27
-
28
-
29
-
30
-
31
-
32
-
33
-
34
-
35
-
36
-
37
-
38
-
39
-
40
-
41
-
42
-
43
-
44
-
45
-
46
-
47
-
48
-
49
-
50
-
51
-
52
-
53
-
54
-
55
-
56
-
57
-
58
-
59
-
60
-
61
-
62
-
63
-
64
-
65
-
66
-
67
-
68
-
69
-
70
-
71
-
72
-
73
-
74
-
75
-
76
-
77
-
78
-
79
-
80
-
81
-
82
-
83
-
84
-
85
-
86
-
87
-
88
-
89
-
90
-
91
-
92
-
93
-
94
-
95
-
96
-
97
-
98
-
99
-
100
-
101
-
102
-
103
-
104
-
105
-
106
-
107
-
108
-
109
-
110
-
111
-
112
-
113
-
114
-
115
-
116
-
117
-
118
-
119
-
120
-
121
-
122
-
123
-
124
-
125
-
126
-
127
-
128
-
129
-
130
-
131
-
132
-
133
-
134
-
135
-
136
-
137
-
138
-
139
-
140
-
141
-
142
-
143
-
144
-
145
-
146
-
147
-
148
-
149
-
150
-
151
-
152
-
153
-
154
-
155
-
156
-
157
-
158
-
159
-
160
-
161
-
162
-
163
-
164
-
165
-
166
-
167
-
168
-
169
-
170
-
171
-
172
-
173
-
174
-
175
-
176
-
177
-
178
-
179
-
180
-
181
-
182
-
183
-
184
-
185
-
186
-
187
-
188
-
189
-
190
-
191
-
192
-
193
-
194
-
195
-
196
-
197
-
198
-
199
-
200
-
201
-
202
-
203
-
204
-
205
-
206
-
207
-
208
-
209
-
210
-
211
-
212
-
213
-
214
-
215
-
216
-
217
-
218
-
219
-
220
-
221
-
222
-
223
-
224
-
225
-
226
-
227
-
228
-
229
-
230
-
231
-
232
-
233
-
234
-
235
-
236
-
237
-
238
-
239
-
240
-
241
-
242
-
243
-
244
-
245
-
246
-
247
-
248
-
249
-
250
-
251
-
252
-
253
-
254
-
 255
255 -
 256
256 -
 257
257 -
 258
258 -
 259
259 -
 260
260 -
 261
261 -
 262
262 -
 263
263 -
 264
264 -
 265
265 -
 266
266 -
 267
267 -
 268
268 -
 269
269 -
 270
270 -
 271
271 -
 272
272 -
 273
273 -
 274
274 -
 275
275 -
276
-
277
-
278
-
279
-
280
-
281
-
282
-
283
-
284
-
285
-
286
-
287
-
288
-
289
-
290
-
291
-
292
-
293
-
294
-
295
-
296
-
297
-
298
-
299
-
300
-
301
-
302
-
303
-
304
-
305
-
306
 |
 |

2014 FORM 10-K
THE WESTERN UNION COMPANY
NOTES TO CONSOLIDATED FINANCIAL STATEMENTS (Continued)
127
(a) Funds included herein have monthly redemption frequencies, with redemption notice periods of one to ten business days.
(b) Substantially all corporate debt securities are investment grade securities.
(c) Hedge funds generally hold liquid and readily priceable securities, such as public equities, exchange-traded derivatives, and
corporate bonds. Hedge funds themselves do not have readily available market quotations, and therefore are valued using
the Net Asset Value ("NAV") per share provided by the investment sponsor or third party administrator. Funds investing in
diverse hedge fund strategies (primarily commingled funds) had the following composition of underlying hedge fund
investments within the pension plan at December 31, 2014: equity long/short (28%), commodities/currencies (24%),
relative value (23%), event driven (13%) and multi-strategy (12%). As of December 31, 2014, funds included herein had
redemption frequencies of monthly to quarterly, with redemption notice periods of three to 60 days.
(d) Diversified investments in royalty rights related to the sale of pharmaceutical products by third parties. Also included are
private equity funds with a focus on venture capital. These investments are illiquid, with investment distributions expected
to be received over the lives of the funds, which are uncertain but based on the voting rights of investors and the maturities
of the underlying investments.
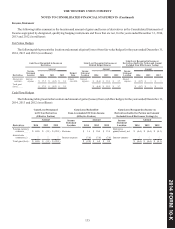
The maturities of debt securities as of December 31, 2014 range from less than one year to approximately 31 years with a
weighted-average maturity of 14 years.
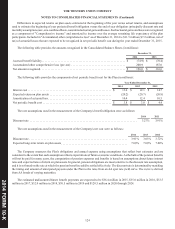
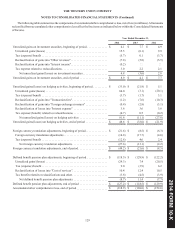
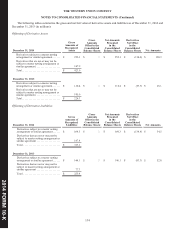
The following tables provide summaries of changes in the fair value of the Trust's Level 3 financial assets (in millions):
Royalty
Rights Private
Equity Total
Balance, January 1, 2013. . . . . . . . . . . . . . . . . . . . . . . . . . . . . . . . . . . . . . . . . . . . . . . $ 21.4 $ 2.4 $ 23.8
Actual return on plan assets:
Relating to assets still held as of the reporting date . . . . . . . . . . . . . . . . . . . . . . . . 2.3 0.3 2.6
Relating to assets sold during the year . . . . . . . . . . . . . . . . . . . . . . . . . . . . . . . . . . 1.6 0.1 1.7
Net purchases and sales. . . . . . . . . . . . . . . . . . . . . . . . . . . . . . . . . . . . . . . . . . . . . . . . (2.0)(0.2)(2.2)
Balance, December 31, 2013. . . . . . . . . . . . . . . . . . . . . . . . . . . . . . . . . . . . . . . . . . . . $ 23.3 $ 2.6 $ 25.9
Actual return on plan assets:
Relating to assets still held as of the reporting date . . . . . . . . . . . . . . . . . . . . . . . . 4.1 0.6 4.7
Relating to assets sold during the year . . . . . . . . . . . . . . . . . . . . . . . . . . . . . . . . . . — 0.1 0.1
Net purchases and sales. . . . . . . . . . . . . . . . . . . . . . . . . . . . . . . . . . . . . . . . . . . . . . . . (2.2) — (2.2)
Balance, December 31, 2014. . . . . . . . . . . . . . . . . . . . . . . . . . . . . . . . . . . . . . . . . . . . $ 25.2 $ 3.3 $ 28.5
Royalty rights are held through investment funds. These investments are priority interests in contractual royalty revenue
derived from the sale of pharmaceutical products that entitle the investment fund to receive a portion of revenue from the patent-
protected product. The investment funds either acquire royalties directly or invest in debt instruments secured by the cash flow
from one or more royalties. The fair value of the direct investments in royalty rights is estimated using consensus Wall Street
analysts' sales estimates for the pharmaceutical products, which are multiplied by the contractual royalty rate, and then discounted
by an interest rate based off the estimated weighted average cost of capital of the pharmaceutical sector, which is then adjusted
for liquidity and diversification considerations. After these adjustments, this discount rate was approximately 10% as of
December 31, 2014. Debt instruments secured by royalties are generally valued based on actual product sales versus revenue
projections at the time of investment and are subject to impairment testing.
Private equity funds invest in the non-marketable securities of individual private companies. These private companies
ultimately may become public in the future. The fair value of the Plan's investment in private equity funds is estimated using many
types of inputs, including historical sales multiples, valuations of comparable public companies, and recently completed equity
financings.